Free research
AI Spending vs the Dot-Com Bubble: What the Filings Show
- Research desk
- Yield Theory Research
- Reviewed
- Evidence
- 5 external references · Method
In 2025, Microsoft, Amazon, Alphabet and Meta spent $376 billion on capex, equal to 1.22% of US GDP. In 2000, at the peak of the telecom bubble, American businesses spent $123 billion on communication equipment: 1.20% of GDP.
So by one measure, four companies are now building at the scale of the whole dot-com telecom boom. But the comparison breaks in an important place. We pulled every annual and quarterly filing for the four companies since 2018, plus the government's investment data back to 2000, to see where AI spending looks like the bubble and where it doesn't.
The short version
- The scale matches the bubble. The four companies' 2025 capex equals the telecom build's peak share of GDP. Their 2026 plans, $720 billion to $745 billion, would be roughly double that share.
- The economy-wide build is still smaller. All US business investment in computers, communication gear and other information equipment was 2.87% of GDP in 2000 and 2.12% in 2025.
- Cash is getting squeezed. Since 2024, the four companies' combined capex has more than doubled, while their free cash flow fell 35%, to $150 billion over the 12 months to June.
- The borrowing has started. Amazon, Alphabet and Meta went from about $110 billion of long-term debt to $317 billion in one year.
- The bubble-like risk sits at the edges. Oracle's capex now exceeds its revenue, and CoreWeave spends almost $3 of capex for every $1 of sales. Both fund the gap with debt.
Is AI spending bigger than the dot-com bubble?
It depends which dot-com number you compare against, and the honest answer uses two.
| Measure | 2000 | 2025 | Source |
|---|---|---|---|
| US business investment in communication equipment | $123.3bn (1.20% of GDP) | $170.0bn (0.55% of GDP) | BEA NIPA Table 5.5.5, line 5 |
| US business investment in computers and peripherals | $103.2bn (1.01% of GDP) | $280.2bn (0.91% of GDP) | BEA NIPA Table 5.5.5, line 4 |
| US business investment in all information processing equipment | $293.8bn (2.87% of GDP) | $652.7bn (2.12% of GDP) | BEA NIPA Table 5.5.5, line 3 |
| Microsoft, Amazon, Alphabet and Meta capex | Not comparable | $376.1bn (1.22% of GDP) | Company 10-K and 10-Q filings |
| Same four, 2026 guidance midpoint | Not comparable | $732.5bn (2.38% of 2025 GDP) | Hyperscaler capex tracker |
GDP is nominal US GDP: $10.25 trillion in 2000 and $30.77 trillion in 2025 (World Bank, from BEA data). BEA figures are from its national accounts, via DBnomics.
Read the table in two directions:
- Four companies now match the telecom peak. In 2000, the whole economy's spending on communication equipment, the routers, switches and fiber gear behind the telecom bubble, reached 1.20% of GDP. In 2025, just four companies spent 1.22%.
- The broad tech build hasn't caught up with 2000. Economy-wide investment in information equipment is 2.12% of GDP, below the 2.87% of 2000. AI servers are moving it fast, though: computer investment jumped 56% in one year, from $179.8 billion in 2024 to $280.2 billion in 2025. The buildings are booming too: US data center construction is running at $85 billion a year (monthly tracker).
The two measures don't line up perfectly. Company capex includes buildings, land and spending outside the US, and the BEA lines count US equipment only. We use the comparison for scale, not as an exact match.
The chart that matters: capex vs free cash flow
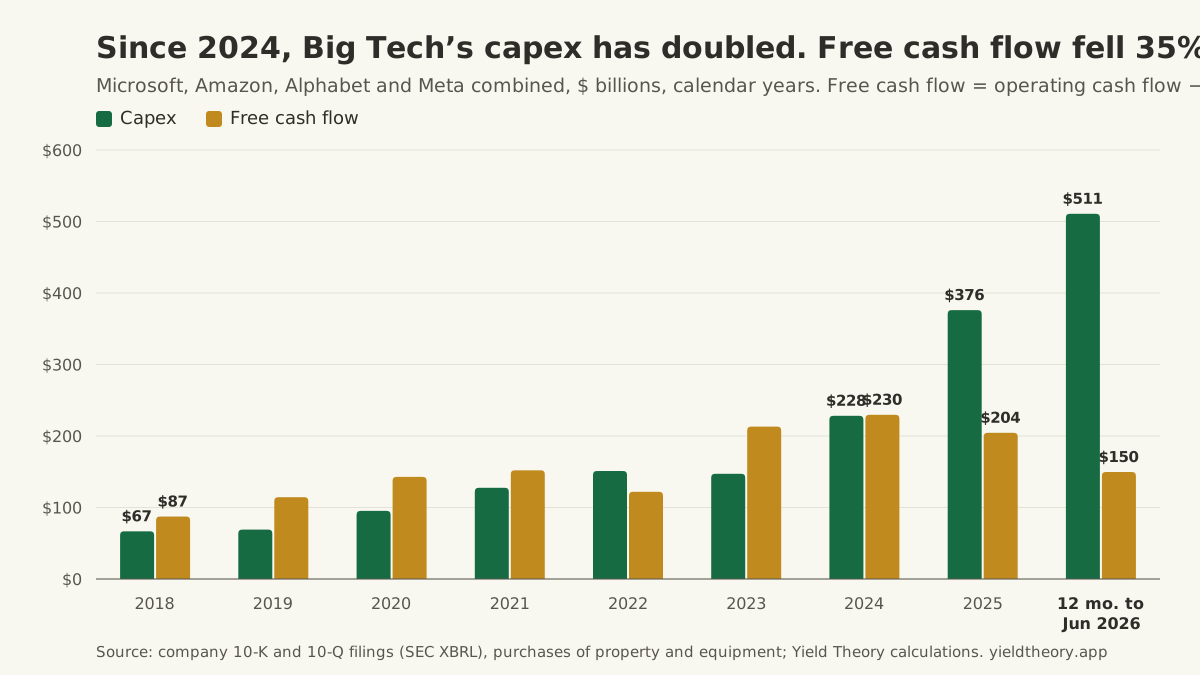
Free cash flow is the cash a business has left after paying for its operations and its investments. It funds buybacks, dividends and acquisitions, and it's the cushion if a bet goes wrong. We calculate it here the simple way: operating cash flow minus purchases of property and equipment.
| Calendar year | Capex | Operating cash flow | Free cash flow | Capex as % of operating cash flow | Capex as % of revenue |
|---|---|---|---|---|---|
| 2018 | $66.7bn | $154.1bn | $87.4bn | 43% | 12% |
| 2019 | $69.1bn | $183.5bn | $114.4bn | 38% | 11% |
| 2020 | $95.2bn | $238.0bn | $142.8bn | 40% | 12% |
| 2021 | $127.6bn | $279.6bn | $152.0bn | 46% | 12% |
| 2022 | $151.1bn | $273.1bn | $122.0bn | 55% | 14% |
| 2023 | $147.2bn | $360.5bn | $213.2bn | 41% | 12% |
| 2024 | $228.3bn | $458.1bn | $229.7bn | 50% | 16% |
| 2025 | $376.1bn | $580.5bn | $204.5bn | 65% | 23% |
| 12 months to June 2026 | $510.7bn | $660.3bn | $149.6bn | 77% | 29% |
Microsoft, Amazon, Alphabet and Meta combined, in calendar years. Microsoft's fiscal year ends in June, so we rebuilt its calendar years from quarterly filings.
From 2018 to 2023, the four companies reinvested about 40% to 55% of their operating cash flow. That ratio is now 77%. Capex has gone from about 12 cents of every revenue dollar to 29 cents, while free cash flow has fallen from its 2024 peak of $229.7 billion to $149.6 billion.
That's still $150 billion a year of cash left over, more than almost any other company in the world earns. The four can keep paying for this, for now. The trend is the warning: each year, more of the build is paid for by cash that used to go to shareholders.
Company by company: who can afford it?
Twelve months to June 30, 2026 (Oracle: to August 31, 2026), from each company's filings.
| Company | Capex | Revenue | Capex as % of revenue | Free cash flow | Long-term debt, a year ago → now |
|---|---|---|---|---|---|
| Microsoft | $115.9bn | $331.8bn | 35% | $67.0bn | $43.2bn → $40.3bn |
| Alphabet | $132.4bn | $445.9bn | 30% | $53.3bn | $24.6bn → $100.2bn |
| Meta | $89.3bn | $228.2bn | 39% | $41.0bn | $28.8bn → $83.7bn |
| Amazon | $173.0bn | $775.7bn | 22% | −$11.6bn | $56.1bn → $133.0bn |
| Oracle | $75.7bn | $71.8bn | 105% | −$28.7bn | $92.6bn → $129.5bn |
| CoreWeave | $20.6bn | $7.6bn | 271% | −$13.7bn | $11.2bn → $35.6bn |
Debt is long-term debt including the current portion, at June 30, 2025 and 2026 (Oracle: notes and borrowings at May 31, 2025 and 2026; CoreWeave: debt carrying amount). Microsoft's capex here is cash purchases of property and equipment, which leaves out data centers it gets through finance leases, so its guidance figure is higher.
Three groups stand out:
- Self-funded: Microsoft. It still has $67 billion of free cash flow, and its debt went down. It's paying for the build from earnings.
- Self-funded, but borrowing anyway: Alphabet and Meta. Both still generate tens of billions in free cash flow, so neither needed debt to cover its capex. Both borrowed anyway: Alphabet's debt quadrupled and Meta's nearly tripled. That's a choice, and one they can afford.
- Spending more than they make: Amazon, Oracle and CoreWeave. Amazon's cash outflow is small for its size, and much of its capex also funds warehouses, robotics and satellites. Oracle and CoreWeave are different. Their capex is far larger than their revenue, and the gap is filled with debt and leases. Our Oracle and CoreWeave capex trackers follow their guidance, backlogs and borrowing quarter by quarter.
Amazon reports free cash flow a little differently. It subtracts capex net of proceeds and incentives, which gave a $7.6 billion trailing outflow in its Q2 release. Our simpler figure is −$11.6 billion. Both point the same way.
Where AI looks like the dot-com bubble, and where it doesn't
The telecom bust is remembered for companies that borrowed to build networks before the customers arrived. Global Crossing and WorldCom both went bankrupt in 2002. US investment in communication equipment fell 32% in two years, from $123.3 billion in 2000 to $83.7 billion in 2002, and the suppliers' sales fell with it.
Set today against that pattern:
| Test | The 2000 telecom build | Big Tech in 2026 | Oracle and CoreWeave in 2026 |
|---|---|---|---|
| Who pays? | Mostly debt and new shares | Mostly operating cash flow | Mostly debt and leases |
| Spending vs revenue | Builders often spent more than they earned | 22%–39% of revenue | 105%–271% of revenue |
| Free cash flow | Often negative | $150bn combined, but falling | Negative |
| Who are the customers? | Startups and carriers, many unprofitable | Their own products plus cloud customers | A small number of AI labs and cloud giants |
The four biggest spenders don't look like Global Crossing. They're spending a rising share of a very large cash stream, and they can cut capex quickly if demand fades. In 2023, Amazon cut capex from $63.6 billion to $52.7 billion and Meta from $31.2 billion to $27.0 billion. The parts of the build that look most like 2000 are the newer, borrowed, concentrated ones: Oracle and CoreWeave, and the private-credit and data-center financing behind them.
Our read
The AI build is not a rerun of the dot-com bust, at least not for the companies paying most of the bill. Microsoft, Alphabet and Meta are spending cash they actually generate, and their debt is a small fraction of their size.
The risk for investors is quieter. Free cash flow at the four biggest spenders has fallen for two years in a row, and their 2026 plans, $720 billion to $745 billion, run more than 40% above the $511 billion they spent in the last 12 months. If AI revenue doesn't grow into that, the first thing to go isn't solvency. It's the buybacks and dividends that shareholders have counted on, and the profit margins that depreciation will squeeze for years. The bubble-like risk sits with the borrowers. If one AI lab's plans change, Oracle and CoreWeave have the least room to absorb it.
What we'd watch: the Q3 reports in late October. Combined free cash flow falling below $100 billion over 12 months, or any of the four cutting 2027 plans, would change the story more than any stock-price move.
Frequently asked questions
Is AI a bubble like the dot-com bubble?
Not in the same way, at least for the biggest spenders. In 2000, much of the telecom build was funded with debt by companies with little or no free cash flow. Microsoft, Amazon, Alphabet and Meta are funding most of their spending from operating cash flow and still produced about $150 billion of free cash flow in the 12 months to June 2026. The scale is similar: their 2025 capex equaled 1.22% of US GDP, close to the 1.20% that communication-equipment investment reached in 2000. The bubble-like features, heavy borrowing and dependence on a few unprofitable customers, show up mostly at Oracle, CoreWeave and the private lenders financing new data centers.
What percentage of GDP is AI capex?
The four largest spenders' capex was $376.1 billion in 2025, or 1.22% of US GDP. Their 2026 guidance of $720 billion to $745 billion equals 2.34% to 2.42% of 2025 GDP. Those are total capex figures. They include buildings, non-AI spending and investment outside the US, so pure AI capex is smaller. Economy-wide US investment in information processing equipment was 2.12% of GDP in 2025.
What is Big Tech's capex-to-revenue ratio?
Over the 12 months to June 2026, capex was 35% of revenue at Microsoft, 30% at Alphabet, 39% at Meta and 22% at Amazon. Combined, the four spent 29 cents of every revenue dollar on capex, up from about 12 cents in 2018–2023. Oracle's ratio was 105% and CoreWeave's 271%.
How much free cash flow do the hyperscalers have left?
Microsoft, Amazon, Alphabet and Meta generated $149.6 billion of combined free cash flow over the 12 months to June 2026, down 35% from $229.7 billion in 2024. Amazon was slightly negative on our measure, at −$11.6 billion, while Microsoft generated $67.0 billion, Alphabet $53.3 billion and Meta $41.0 billion.
Are tech companies borrowing to pay for AI?
Increasingly, yes. Between June 2025 and June 2026, long-term debt rose from $56.1 billion to $133.0 billion at Amazon, from $24.6 billion to $100.2 billion at Alphabet, and from $28.8 billion to $83.7 billion at Meta. Microsoft's debt fell slightly, from $43.2 billion to $40.3 billion. Oracle's notes and borrowings reached $129.5 billion in May 2026, up from $92.6 billion a year earlier, and CoreWeave's debt more than tripled to $35.6 billion.
How we calculated this
- Company data: annual and quarterly figures from each company's 10-K and 10-Q filings, read from the SEC's XBRL company facts. Capex is purchases of property and equipment (Amazon: gross purchases, before proceeds and incentives). Free cash flow is operating cash flow minus that capex. Twelve-month figures add the latest year-to-date filing to the prior fiscal year and subtract the prior year-to-date.
- Recent filings used: Amazon Q2 2026 10-Q, Oracle fiscal 2026 10-K, Oracle Q1 fiscal 2027 10-Q, plus the Microsoft, Alphabet, Meta and CoreWeave filings linked from the hyperscaler capex tracker.
- Macro data: BEA NIPA Table 5.5.5, private fixed investment in equipment by type, current dollars; nominal GDP from the World Bank's BEA-based series.
Limits of this data
- Company capex and BEA equipment investment measure different things, so the GDP comparison shows scale, not an exact equivalence.
- Our free cash flow uses one simple formula for every company, so it won't match each company's own definition. Meta, for example, also subtracts finance-lease payments.
- Microsoft's figures exclude finance leases, which understates its total build.
- Results are as of the latest filings: June 30, 2026 for most companies and August 31, 2026 for Oracle. We'll update after the Q3 reports.
Go deeper with member research
The filings show how much is being spent and who's borrowing. Member reports follow the money to the companies on the other side of it:
- Issue 02: The AI Capex Shock: where the next AI infrastructure dollar goes, which bottlenecks keep pricing power, how the boom is being financed, and what could break first.
- Issue 05: NVIDIA Is Building the Credit Market for AI: how AI infrastructure is moving from equity into private credit, insurance balance sheets and securitized debt, and why that matters for the borrowers in the table above.
- Issue 03: The AI bill is arriving late to earnings: why today's capex becomes tomorrow's depreciation, and which companies' margins take the hit first.
Companies in this research
Continue the research
Members-only research
Members are reading this
Sep 22, 2026
Meta jumped 11%. What must happen next to justify the price?A member research report on Meta’s AI rally: Muse, subscription economics, the cash-flow burden, legal costs and the earnings assumptions behind the new price.
Sep 9, 2026
Lam Research and the economics of harder-to-build memoryA retrospective case study of what Lam Research’s NAND conversions, manufacturing complexity and cash conversion showed on January 30, 2026, with the later results kept separate.
The thesis, the numbers behind it, and what would break it. Full access is $39 a month.
Read the full research