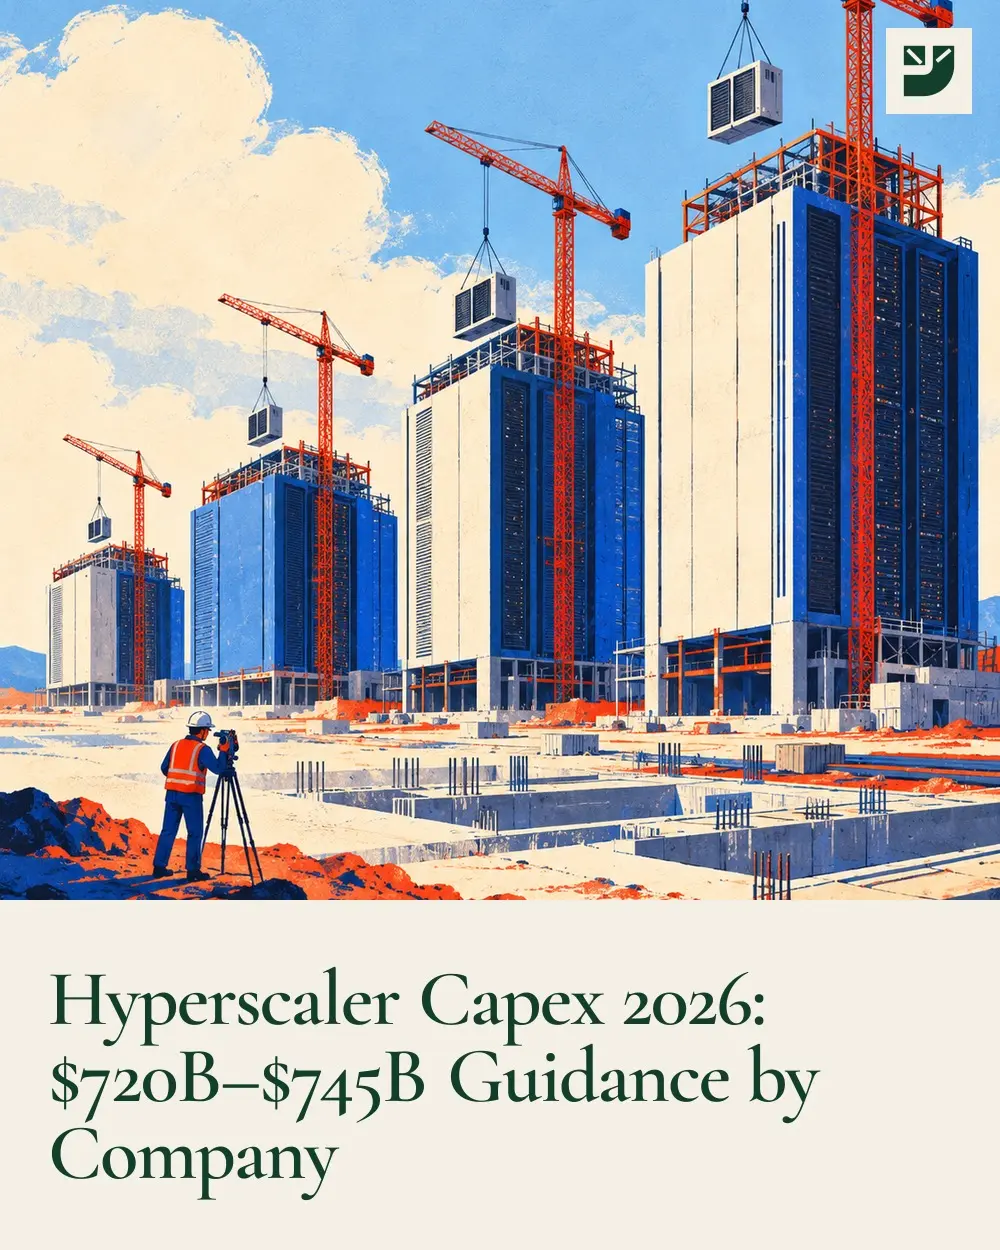
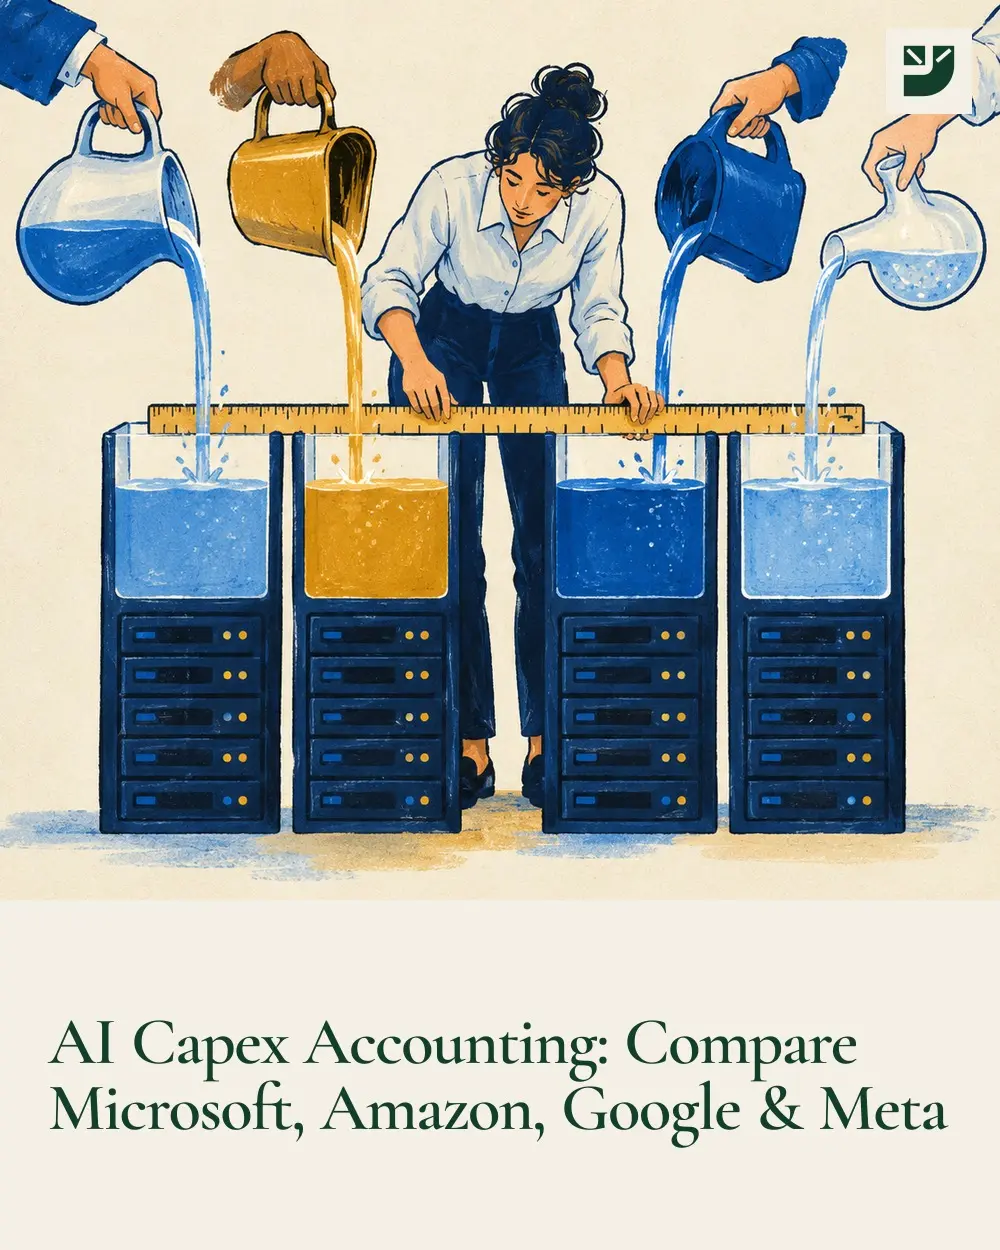
Microsoft guides to about $175 billion of calendar-2026 capital expenditure, per CFO Amy Hood on the July 29, 2026 fiscal Q4 call. That is down from about $190 billion only because more data-center leases became operating leases, which capex excludes. Fiscal Q4 capex (April–June 2026) was $41 billion, including $5.6 billion of finance leases.
Amazon expects about $220 billion of companywide cash capital expenditure in 2026, raised on July 30, 2026 from about $200 billion, mainly on memory costs. It covers AWS and AI plus fulfillment, robotics and satellites. Cash property purchases were $98.4 billion in the first half (Forms 10-Q), about 45% of the plan.
Alphabet guides to $195 billion–$205 billion of 2026 capital expenditure, raised on its July 22, 2026 Q2 call from $180 billion–$190 billion. That is roughly double 2025's $91.4 billion at the midpoint. Q2 2026 capex was $44.9 billion, about 60% servers and 40% data centers and networking, after $35.7 billion in Q1.
Meta guides to $130 billion–$145 billion of 2026 capital expenditure, including finance-lease principal, after raising the low end from $125 billion in its July 29, 2026 Q2 results. Reported capex was $19.84 billion in Q1 and $31.08 billion in Q2, so first-half spending of $50.92 billion equals 35%–39% of the full-year range.
Start with the spending envelope, preserve the accounting differences, locate the physical bottleneck, and test whether the new capacity is producing a return. Each page answers a different investment question.
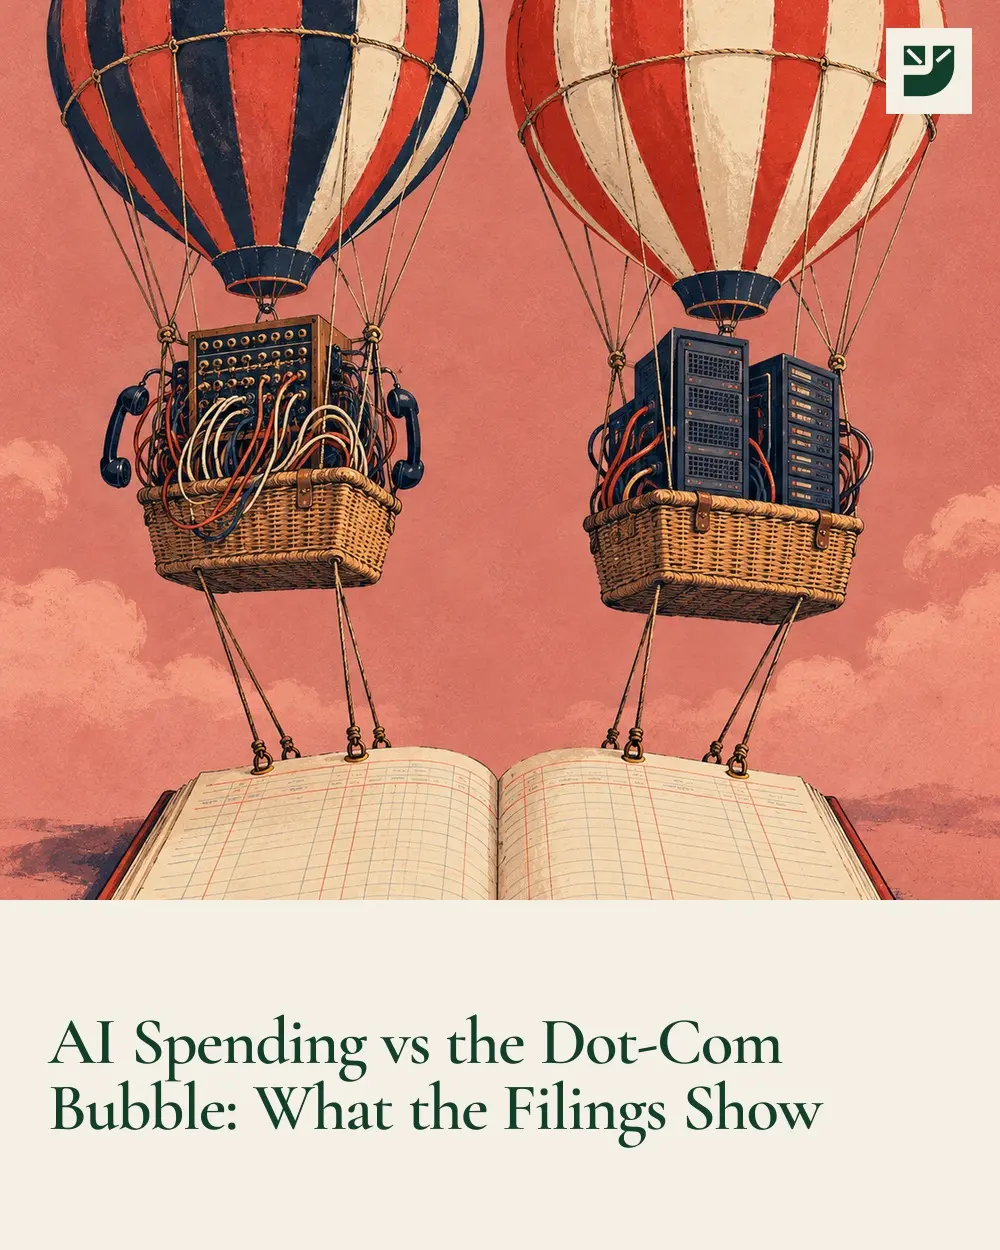
Big Tech's 2025 capex hit 1.22% of US GDP, the telecom bubble's peak share. Free cash flow is down 35% since 2024, and three of the four have nearly tripled their debt.
Microsoft, Amazon, Alphabet, and Meta 2026 guidance and reported quarterly spend in CSV or JSON, with a field dictionary, sources, and limitations intact.
Only 28% of today's S&P 500 companies beat the index over ten years. Six stock research mistakes that make picking winners even harder, and what each one cost.
Costco's membership fees are 2% of its revenue and 51% of its operating profit. Seven plain-English questions to ask before buying any stock, answered on Costco.
Only 41% of the S&P 500 companies we scored pass all six checks: revenue growth, margin, cash conversion, debt, share count and P/E. What normal looks like.
Five methods on Coca-Cola give values from $8.40 to $90.91 a share, against a recent price of $92.68. Each one worked step by step from its SEC filings.
We ran Coca-Cola through 7 free valuation calculators. Fair values ran from $37.80 to $93.25 against a $92.68 price. Which to use, and why they disagree.
The earnings-yield test calls 30% of the S&P 500 cheap; the Graham number, 9%. Only 7 of 445 stocks pass all five fair-value formulas, each worked on real filings.
About 1,250 companies warned in their own 10-K in the past year that they might not survive. The 8 red flags in an annual report, with real filings for each.
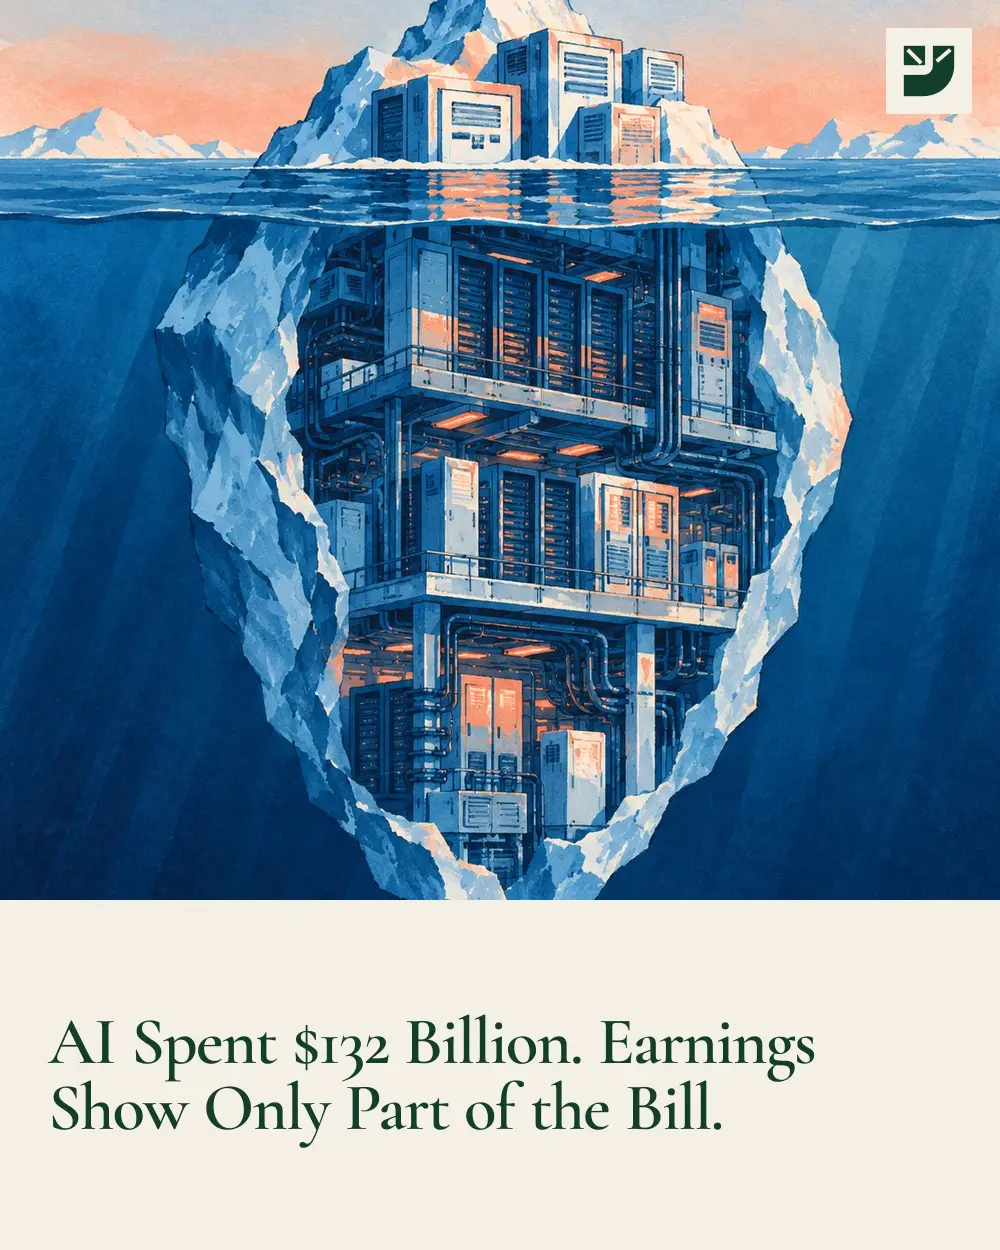
Six AI builders have signed $1.15 trillion of leases that haven't started yet, more than twice their $517 billion of debt. Microsoft's $329 billion is eight times what it owes. Every number, from their SEC filings.
Meta owes $83.7bn in debt, but its filing lists $279bn of signed data center leases that haven't started and a $28bn guarantee on one Louisiana venture. Every number, from the 10-Q.
Alphabet stopped buying back stock and started selling it. Amazon now owes more than it holds. Meta's cash cushion is down to $6.6bn. Debt, cash, share counts and interest bills for six AI builders, from their SEC filings.
Oracle guides to $90B–$95B of fiscal 2027 capex on at least $90B of revenue. It spent $28.5B in one quarter. Every guidance change, the backlog and the borrowing behind it.
US data center construction hit an $85.0B annual rate in August 2026, up 73% in a year. It has passed offices, warehouses and chip factories. Monthly Census data since 2014.
CoreWeave guides to $35B–$39B of 2026 capex on $12.4B–$13.2B of revenue, about $3 of building for every $1 of sales. Why its bonds now yield over 15%, the $10.6B due by 2027, the backlog and the customers.
22 of the 39 trades Nancy Pelosi disclosed since December 2024 involved call options. Her household's full holdings, every trade, and how they did against the S&P 500.
Stock Advisor sends 2 picks a month for $199 a year. Epic sends 7 for $499. Over five years, Epic adds up to about 420 recommendations. How the plans compare, and how to choose from the list.
Analysts expect Alphabet, Amazon, Microsoft and Meta to spend about $935B on capex in 2027. None has given a number yet. Here's what each said, and the math.
Microsoft's net income rose 31% last year while its free cash flow fell 6%. Both facts sit in the same 10-K. The sections to read, in order, and what to check.
We priced every disclosed congressional stock purchase since June 2024. Copied on the filing date, the typical buy trailed the S&P 500 by 3.5 points over six months.
Burry says Big Tech will understate depreciation by $176 billion through 2028. The filings back his direction, Amazon's reversal is the tell, and his number is plausible only if AI servers last 3–4 years.
You can research a stock properly for $0. We priced 12 research sites on 2 October 2026 and sorted them by the job they do best, from free filings and screeners to paid picks and independent research.
The STOCK Act doesn't ban congressional stock trading, and a late filing usually costs $200. The ban bill, H.R. 7008, passed the House but fell seven votes short in the Senate.
NANC copies Democrats' disclosed stock trades, GOP (formerly KRUZ) copies Republicans'. Both trade up to 45 days late, and their own prospectus says so.
Members of Congress get up to 45 days to report a trade, so no tracker is real time. How Capitol Trades, Quiver and Unusual Whales compare on lag and price.
Congress trade filings can land 45 days after the trade and show ranges like $1,001–$15,000, not dollars. How to read each field and check a tracker row.
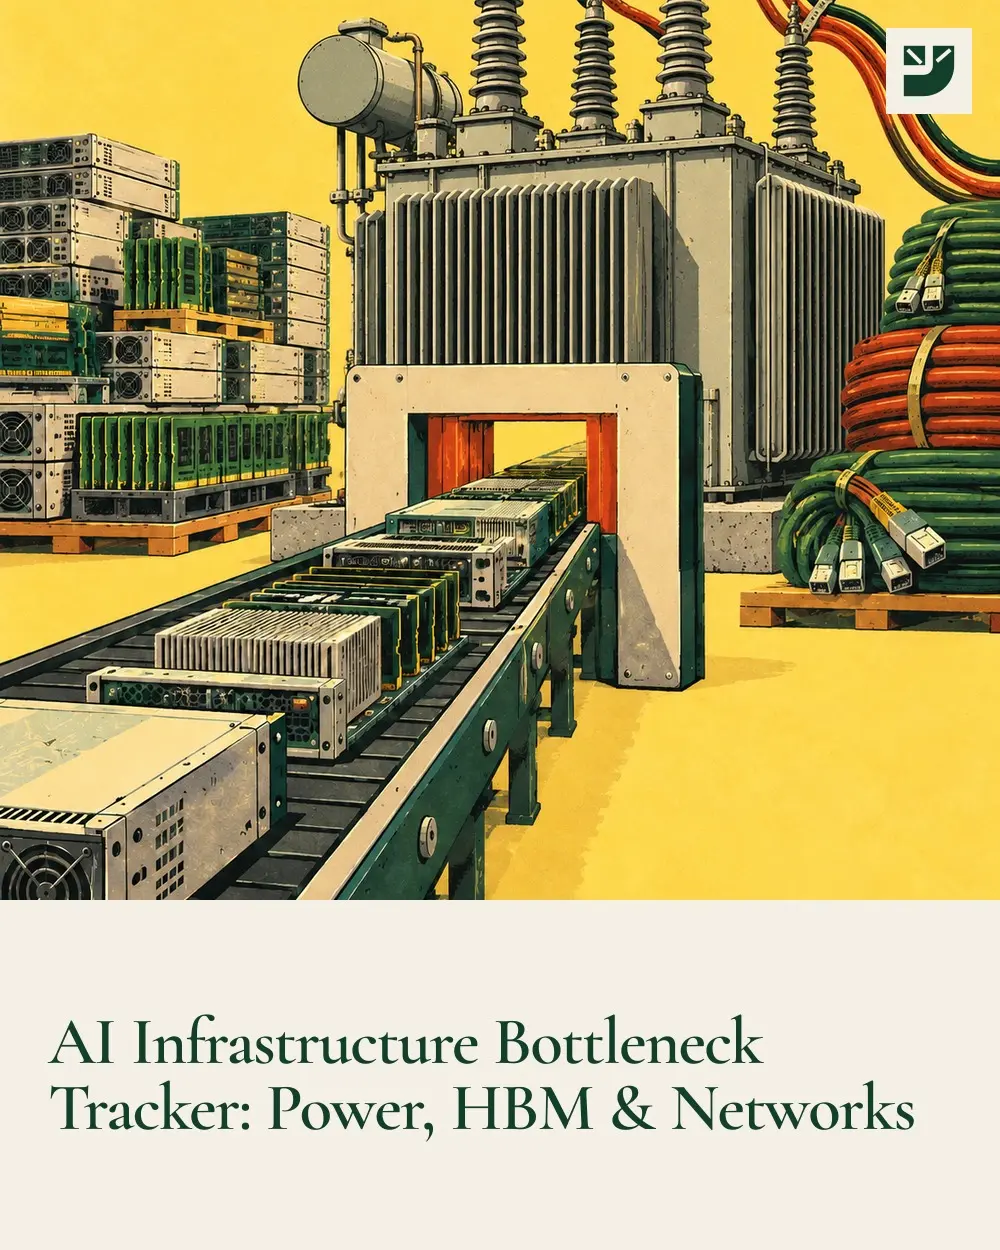
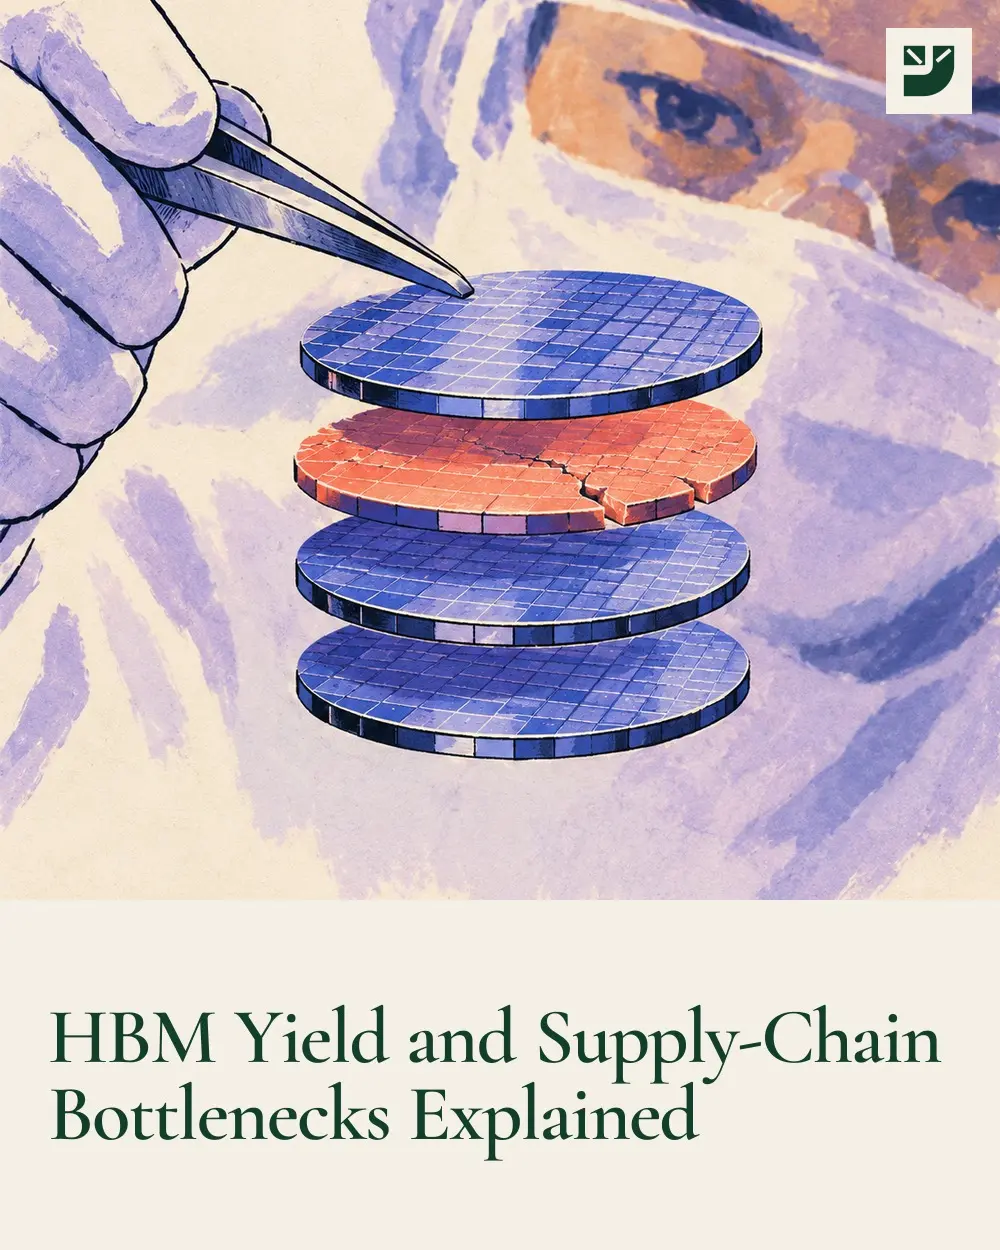
An HBM stack can hold 12 memory dies, and one bad layer can scrap it. Why wafer starts overstate AI memory supply, and where output really bottlenecks.
Sell €100 million in Europe, report $10 million less when the euro slips from $1.10 to $1.00. How the dollar index reaches stocks, and when it doesn't.
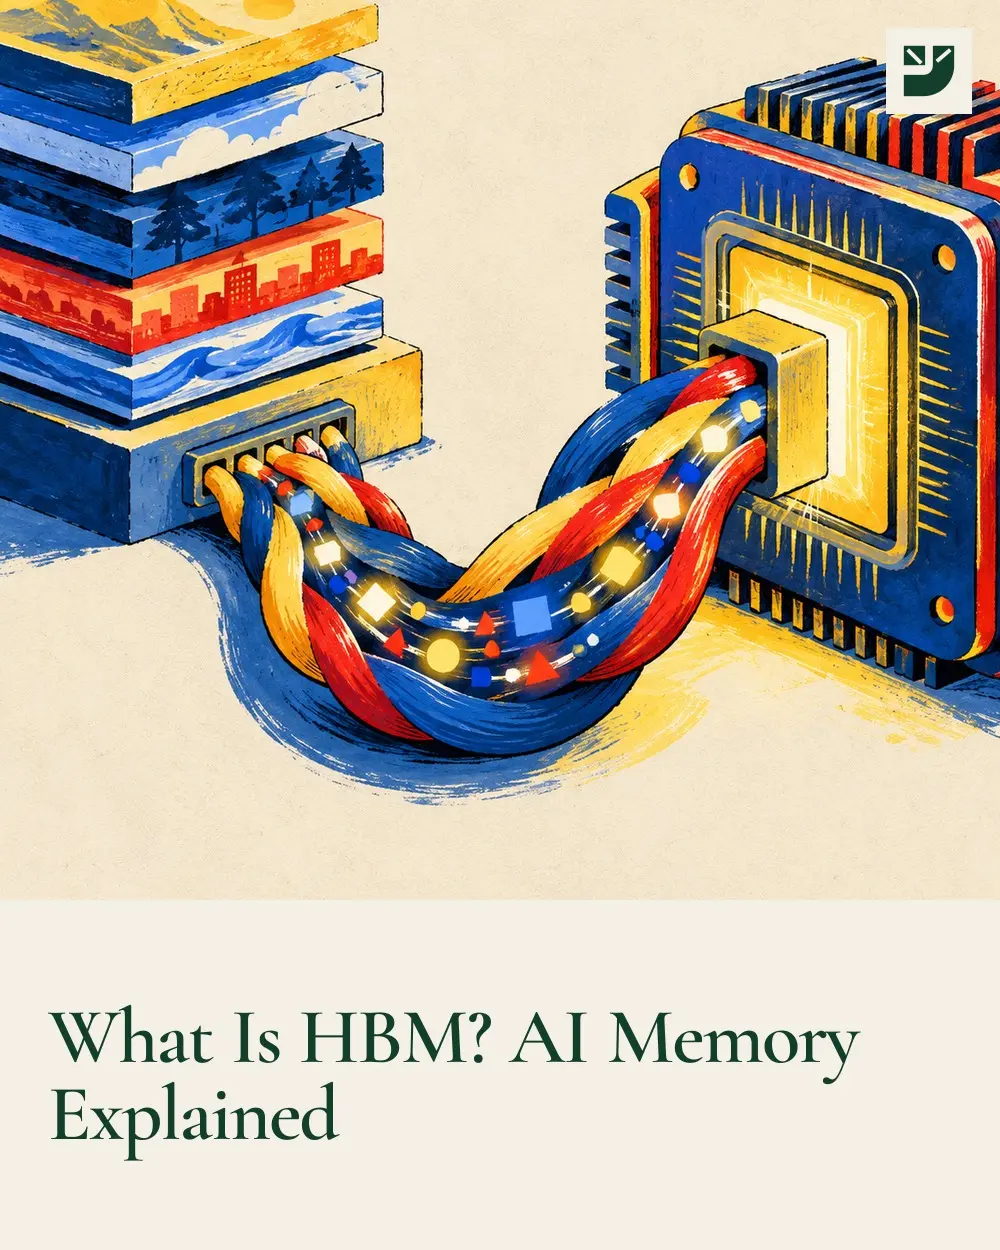
NVIDIA's H200 moves 4.8 TB of data a second through its HBM. What high-bandwidth memory is, why AI chips starve without it, and what investors should watch.
Broadcom's AI chip revenue hit $10.8B in a quarter, up 143%. Custom silicon is already big business. Where it beats GPUs on cost, and where GPUs still win.
A data center can be built in 1-3 years. The grid upgrade it needs can take 5-15. Why AI's power problem is connection, not generation, and what to track.
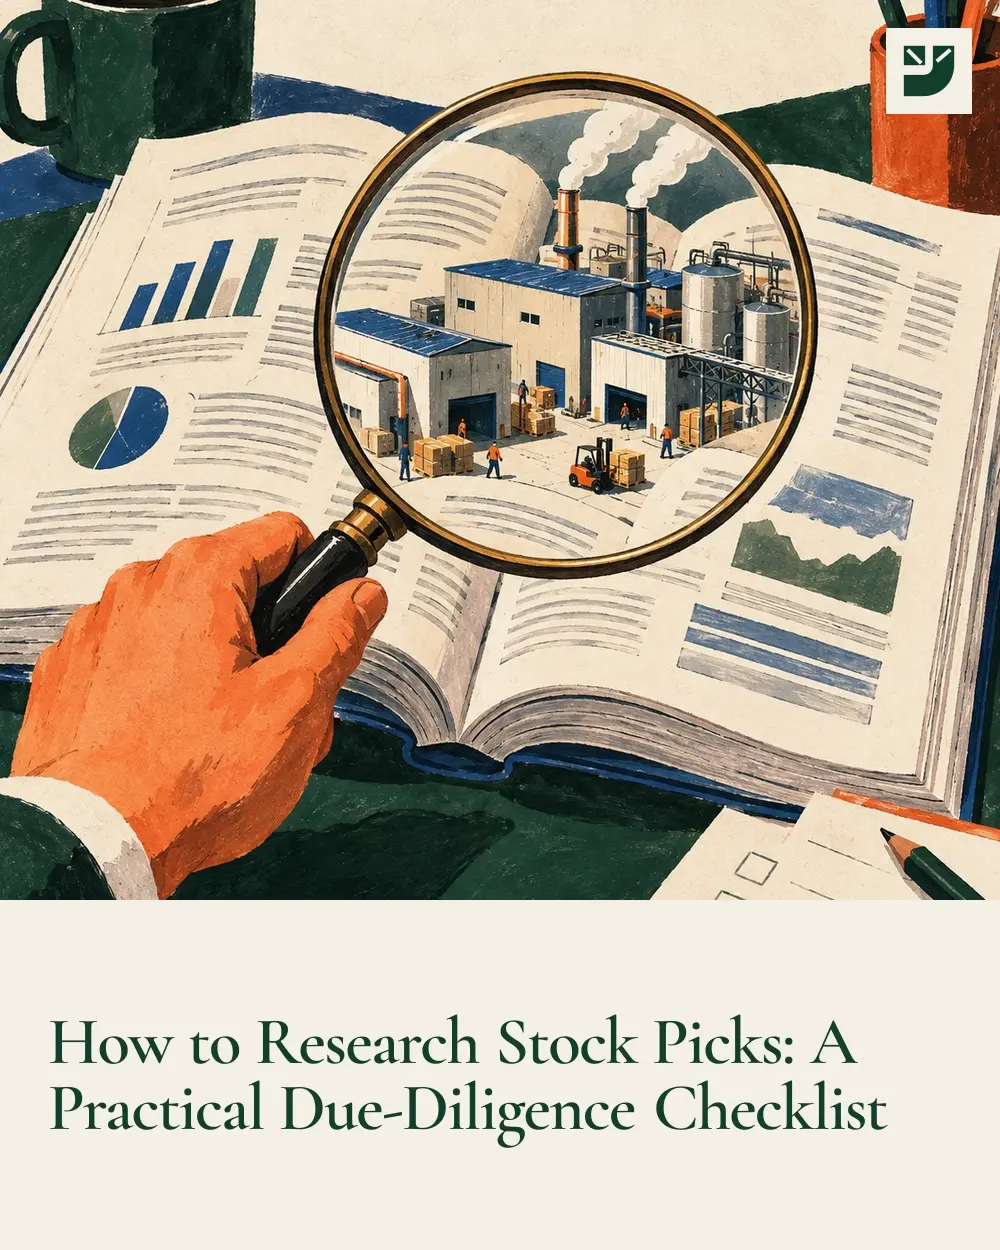
A great company can be a bad buy if the price assumes too much. A 7-question checklist using the 10-K, the 10-Q and a one-sentence thesis you can test.
Turn the research into a portfolio thesis.
The research stays open. Members get the monthly flagship, the weekly checkpoint, and the evidence that would break the call. $39/month or $249/year.