7 Free Stock Valuation Calculators, Tested on the Same Stock
The seven free stock valuation calculators worth using are Alpha Spread (best ready-made model), ValueInvesting.io (ten methods on one page), Aswath Damodaran's spreadsheets (best Excel template), Moneychimp (simplest), Omni Calculator, VI Stack (a free reverse DCF) and our own DCF pair. Tested on  Coca-Cola, they put its fair value anywhere from $37.80 to $93.25 a share, against a recent price of $92.68. Four got identical inputs from us and still disagreed by 58%. So pick a calculator whose inputs you can see and change, then run a reverse DCF (it works back from the price to the growth the price assumes) before you trust any answer.
Coca-Cola's recent price is $92.68 a share. We asked seven free calculators what it's worth.
Two tools fill in their own assumptions. Alpha Spread says $73.55. ValueInvesting.io says $93.25.
Four tools got the same five inputs from us. They still landed between $37.80 and $59.81.
One stock, one day: the top answer is about 2.5 times the bottom one.
The seventh tool runs it backward. To justify $92.68, free cash flow must grow 10.6% a year for a decade.
Which free valuation calculator should you use?
It depends on how much you want to type yourself. Here's how the seven compare on Coca-Cola, then who each one suits.
| Calculator | Type | Coca-Cola result | What you control | Account | Free limit |
|---|---|---|---|---|---|
| Ready-made DCF | $73.55 (bear $59.93, bull $86.03) | Bear, base or bull case | Free account | 3 stock reports a week | |
| Ready-made, ten models | $93.25 (models span $36.29 to $135.27) | Choice of ten models | Free account | Full access to 5 stocks a month | |
| Excel model | $52.07 | Every input | None | None | |
| Plug-in DCF | $59.81 | 5 inputs | None | None | |
| Plug-in DCF | $37.80 | 6 inputs | None | None | |
| Reverse DCF | Price needs 10.6% growth a year | 5 inputs | None | None | |
| Yield Theory (ours) | Plug-in DCF and reverse DCF | $59.81; price needs 10.61% growth | 8 inputs | None | None |
- You want a number fast, with the assumptions shown: Alpha Spread.
- You want to compare many methods at once: ValueInvesting.io, but check its discount rate first (section 2).
- You want an Excel template you control: Damodaran.
- You want the simplest possible tool: Moneychimp.
- You want to know what the price already assumes: VI Stack or our reverse DCF calculator.
How we tested them
A stock's fair value, or intrinsic value, is what a share is worth based on the cash the business will produce. Most of these tools estimate it with a discounted cash flow (DCF): forecast the cash, then shrink each future year back to today's dollars at a discount rate, the yearly return you require for the risk. The years after the forecast get one lump sum, the terminal value, usually by assuming the cash keeps growing slowly forever.
Two tools fill in a company's numbers for you, so we recorded their own answer for Coca-Cola. Into the other five, four DCF calculators and one reverse DCF, we typed the same inputs:
| Input | Value | Where it comes from |
|---|---|---|
| Free cash flow per share | $2.64 | Operating cash flow of $7.41 billion, minus $2.11 billion of capital spending, plus a one-time $6.07 billion payment, over 4.313 billion diluted shares ( |
| Growth | 5% a year for 10 years | Above the 3.6% a year Coca-Cola's free cash flow grew over the past ten years, so the test is generous to the stock |
| Terminal growth | 2.5% a year after that | Our choice: slower than the forecast years. Our intrinsic value guide uses 3%, which lifts the DCF to $63.60 and cuts the growth the price needs to 9.8% |
| Discount rate | 8% | Close to what GuruFocus (8%) and Alpha Spread (8.4%) chose for Coca-Cola. With the 10-year Treasury at 5.13%, it's a low rate, so it also favors the stock |
| Share price | $92.68 | A recent close |
Free cash flow is the cash left after the business pays to run and maintain itself: operating cash flow minus capital spending. Coca-Cola reported $5.30 billion of it last year. But that figure absorbed $6.07 billion of the final payment for fairlife, a dairy brand Coca-Cola bought, a one-time cost its latest 10-Q spells out. We added it back, to $11.37 billion. Where a tool asked for net cash, we entered zero. Operating cash flow is counted after interest, so the lenders' share is already out; subtracting debt too would charge for it twice.
1. Alpha Spread: the best ready-made DCF calculator
Alpha Spread puts Coca-Cola's DCF value at $73.55, 21% below the price. Its bear case says $59.93 and its bull case $86.03, so even the optimistic version sits below $92.68.
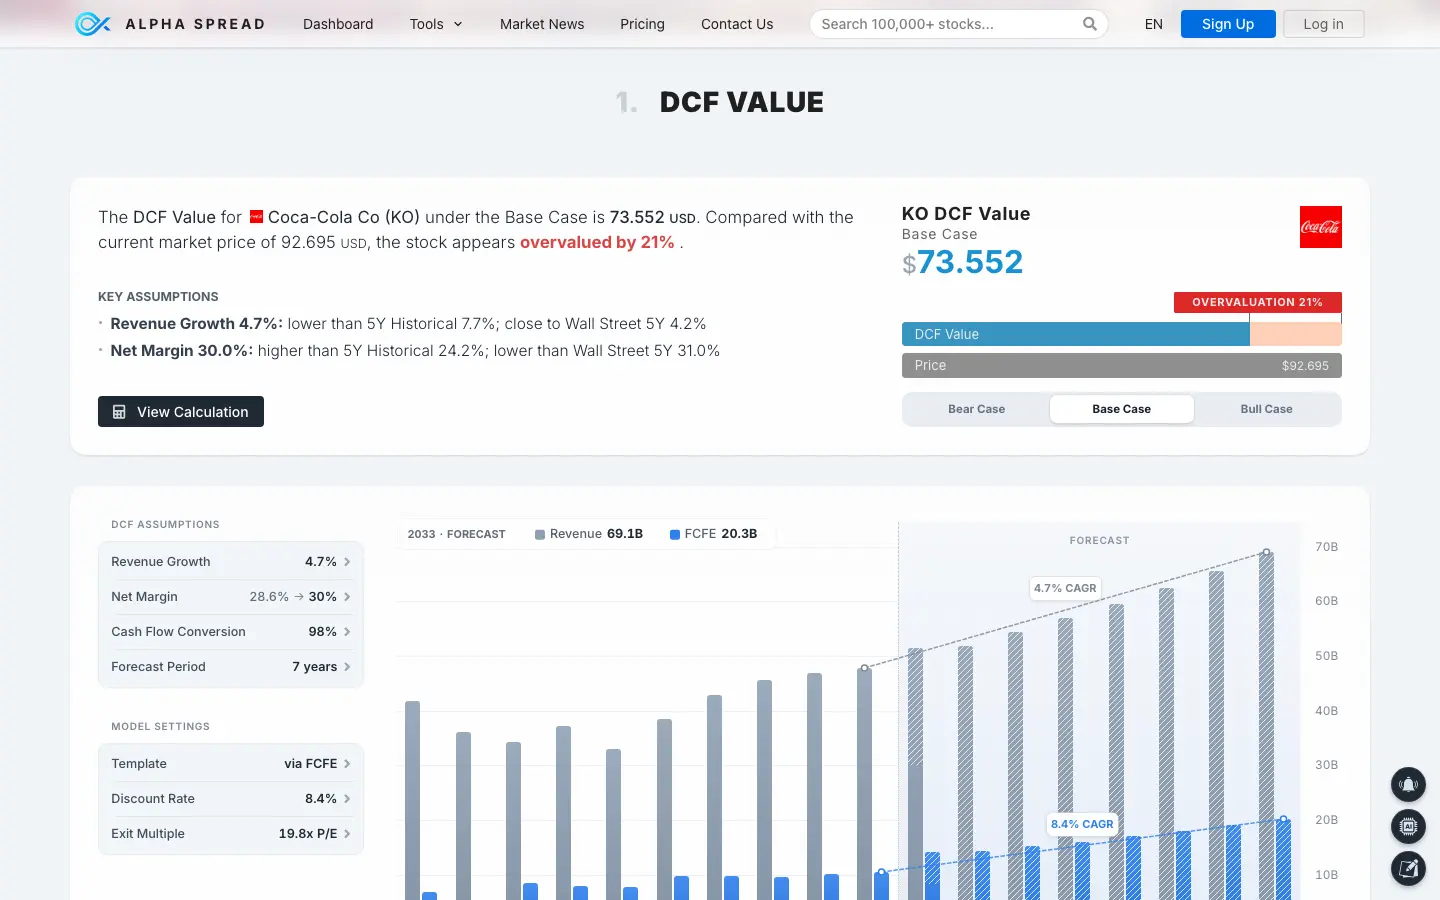
What we like is that it shows its work. The base case forecasts revenue growth of 4.7% a year for seven years, a net margin rising from 28.6% to 30%, and 98% of profit turning into cash. It discounts at 8.4%. The page also has a reverse DCF that tests one assumption at a time.
The drawback: rather than projecting cash flow past year seven, the model assumes the stock sells at 19.8 times earnings then. That price-to-earnings multiple is a guess about the market's mood, the very thing a DCF is meant to look past. A sign-up sheet also covers the page until you close it. A free account gets three stock reports a week; paid plans cost $144 or $240 a year.
2. ValueInvesting.io: ten valuation methods on one page
ValueInvesting.io gives the most for free: ten valuations of Coca-Cola on one page. The headline number, a five-year DCF, is $93.25, almost exactly the price. The other nine run from $36.29 to $135.27.
Seven of the ten values sit below the recent price of $92.68. EBITDA is profit before interest, taxes, depreciation and amortization.
Its homepage says you can see every assumption and change it, and the free plan gives full access to five stocks a month. We didn't open an account, so we couldn't test the editing.
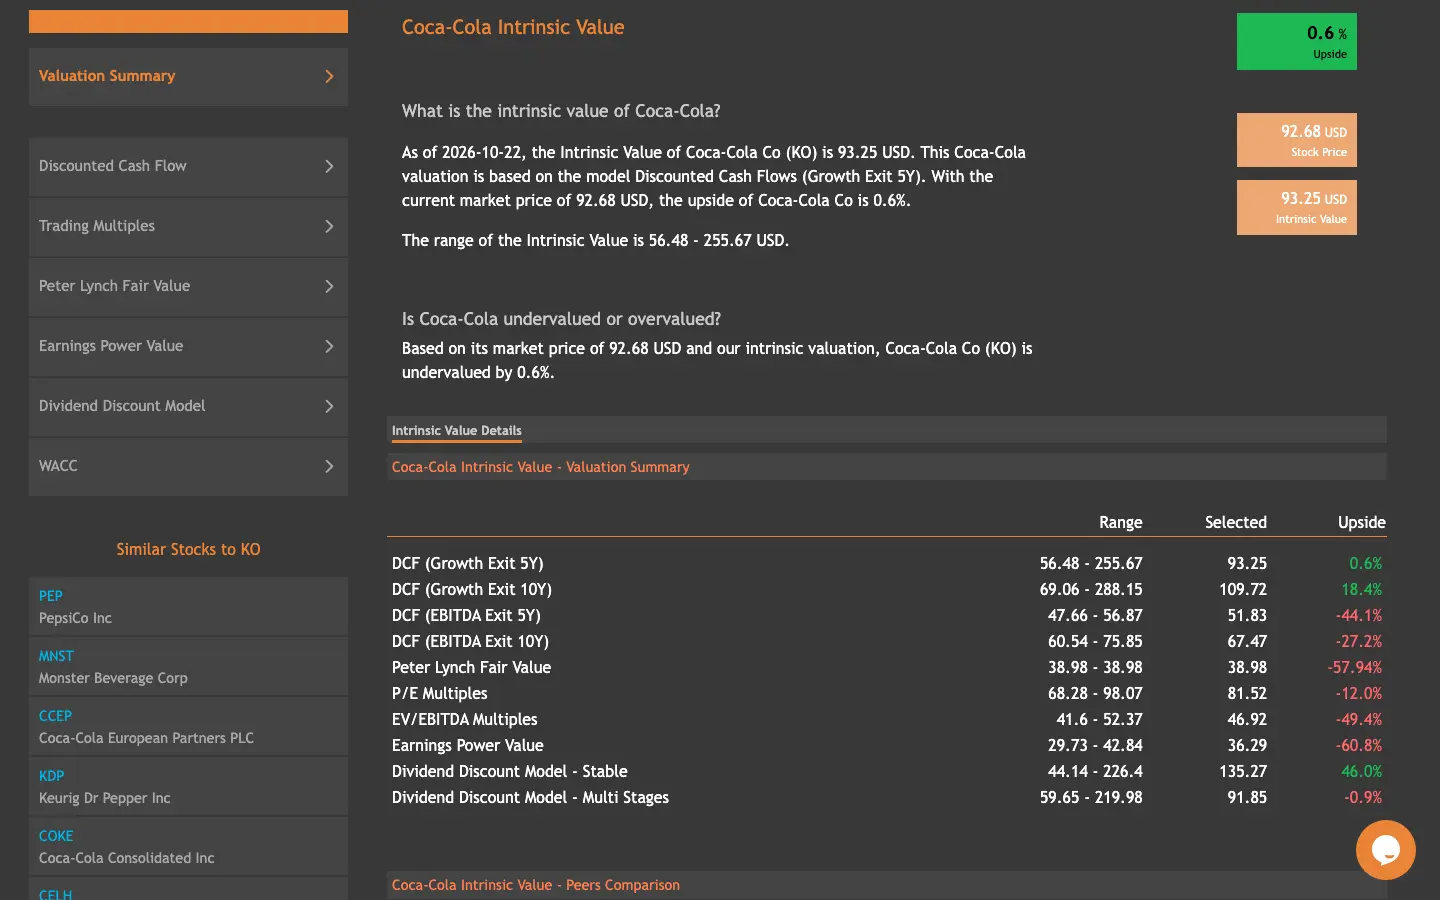
The drawback: check the discount rate before you trust the headline. ValueInvesting.io discounts Coca-Cola's cash at 6.0%. That rests on a 6.3% cost of equity (the return shareholders demand) and a beta of −0.01. Beta measures how much a stock moves with the market, and −0.01 treats Coca-Cola as if it ignored the market entirely. The page doesn't show how one becomes the other. Either way, 6.3% is barely more than the 5.13% a 10-year Treasury pays with no business risk. A rate that low does most of the work. In our own test, dropping from 8% to 6% was enough on its own to lift Coca-Cola's value past the price.
3. Damodaran's spreadsheets: the best free valuation Excel template
Aswath Damodaran teaches valuation at NYU's Stern School and posts dozens of his models free, no account needed. We used his two-stage model for free cash flow to equity (the cash left for shareholders after lenders are paid), fcfe2st.xls. With our five inputs it gave $52.07.
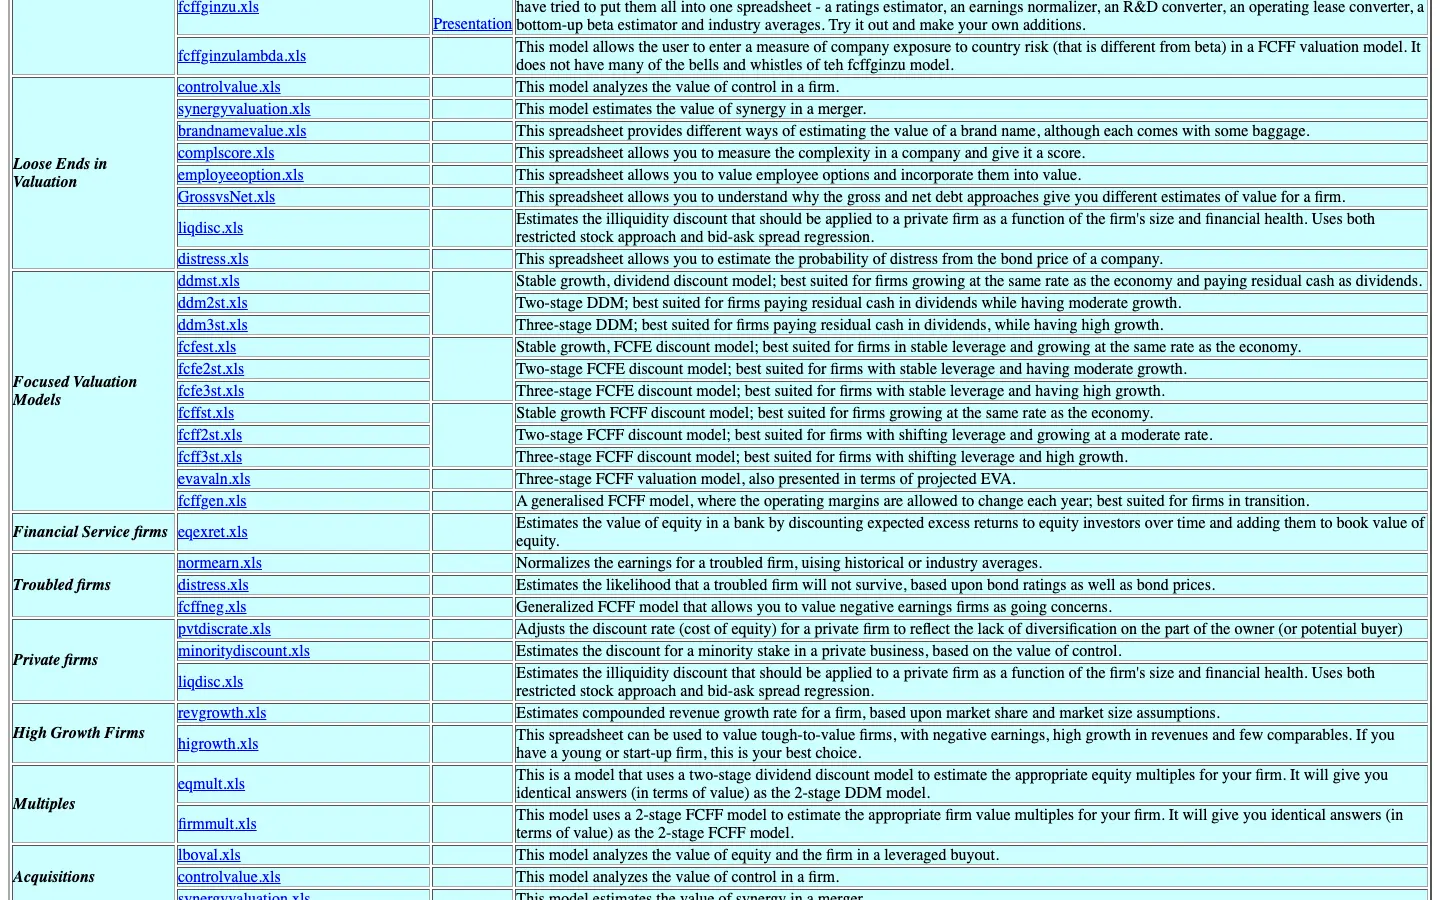
Why lower than Moneychimp's $59.81 on the same numbers? After year ten, the spreadsheet makes the company pay for its growth. A business can't grow 2.5% a year forever without reinvesting some of its profit, so the model holds back growth divided by return on equity (profit as a share of the shareholders' money in the business). At the sheet's default 12% return on equity, that's about a fifth of every later year's cash. Coca-Cola actually earned 40.7% on its equity last year ($13.1 billion of net income on $32.2 billion of year-end equity). Enter that, and the value rises to $57.53.
The drawback: it looks dated, it has dozens of input cells, and you need Excel or Apple Numbers. One trap: if you type the discount rate in directly, the years after year ten still take their rate from the beta cells. Set both to match.
4. Moneychimp: the simplest free DCF calculator
Moneychimp is five boxes and one answer, with no account and no sign-up. With our inputs it says $59.81.
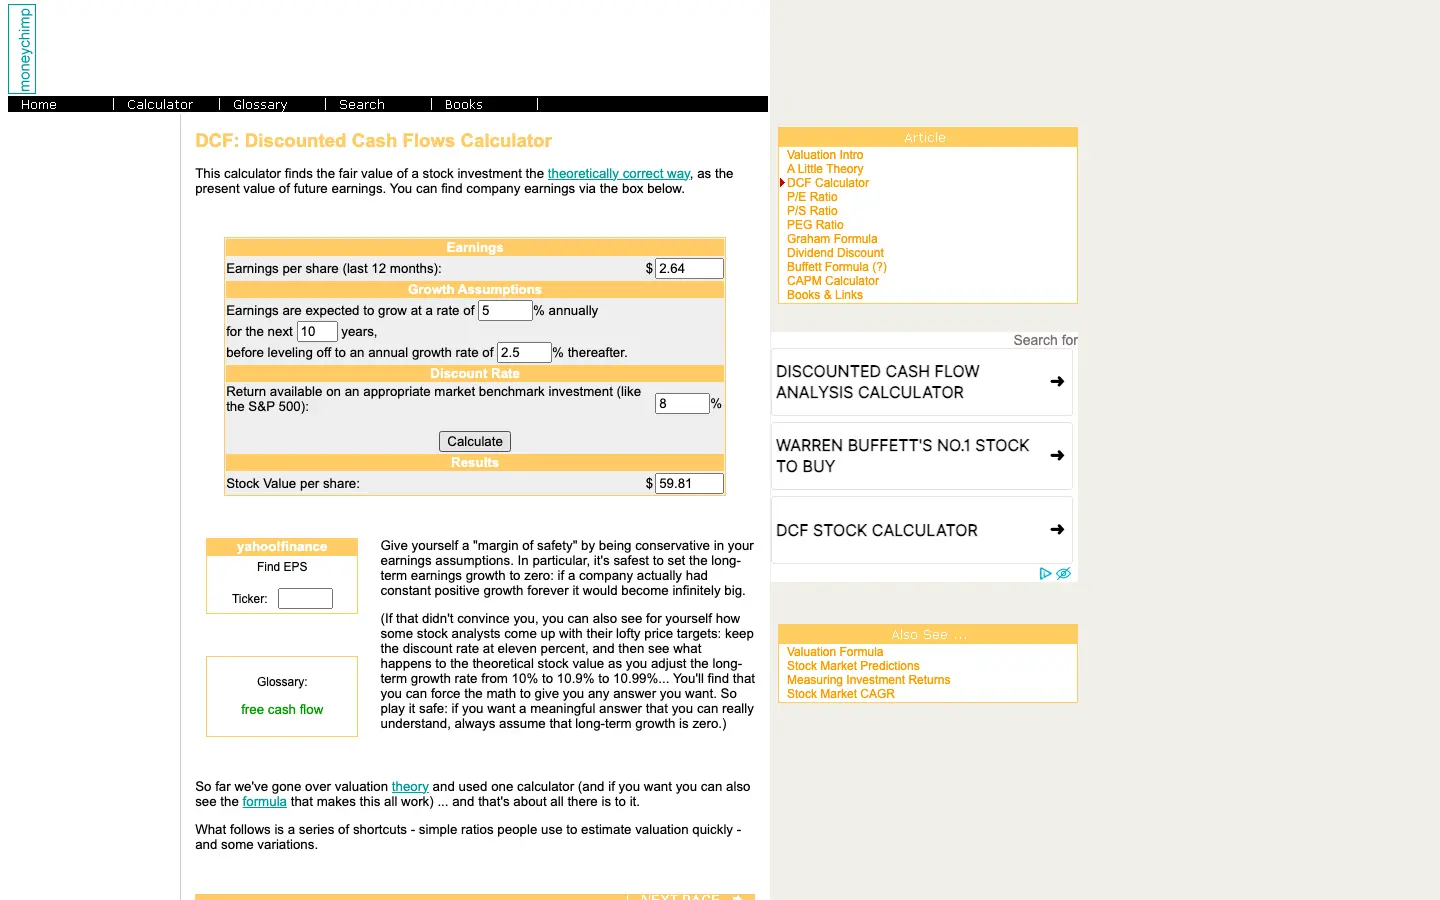
Its defaults are deliberately harsh: five years of growth, then 0% growth forever, discounted at 11%. The page argues that zero long-term growth is the safe choice. Keep our $2.64 and 5% growth but leave those defaults alone, and Coca-Cola is worth $29.39.
The drawback: it loads no company data and gives no range of outcomes. It labels the input "earnings per share", which tempts people to type profit rather than cash. It also rounds per-share inputs to the cent.
5. Omni Calculator: a free online DCF calculator with a cutoff
Omni Calculator's DCF tool is clear and free, but its earnings method only counts cash for as many years as you tell it to. You have to pick that number. With our inputs and a 10-year terminal stage, it says $37.80, the lowest of the seven.
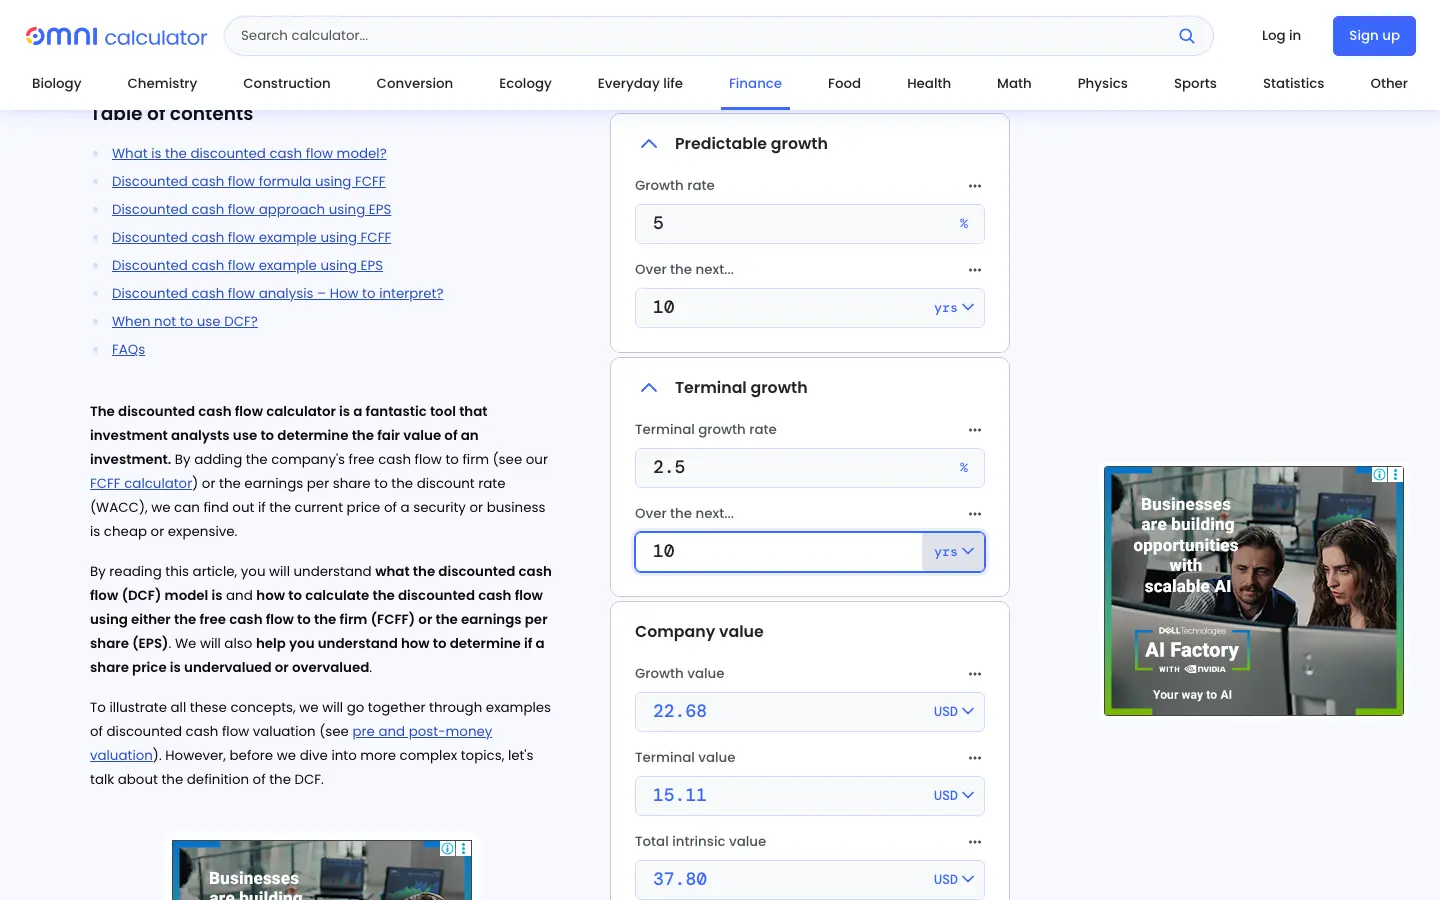
Omni's terminal value covers only the years you enter, then assumes the cash stops. Moneychimp and our calculator let it continue forever at 2.5%, which is worth $22.01 a share more here. Ten years is generous: Omni's own worked example uses five, which would give $31.22. Enter 30 and you get $52.07. Omni also has a second method that starts from cash flow to the whole firm and subtracts net debt.
The drawback: the answer swings with a number most users won't think about, and the page doesn't warn you. Its default discount rate is 11%, and the page is busy with ads.
6. VI Stack: a free reverse DCF calculator
VI Stack's reverse DCF flips the question: what does the price already assume? It starts from the share price and solves for the growth that would justify it. At $92.68, with our inputs, Coca-Cola's free cash flow has to grow 10.6% a year for a decade.
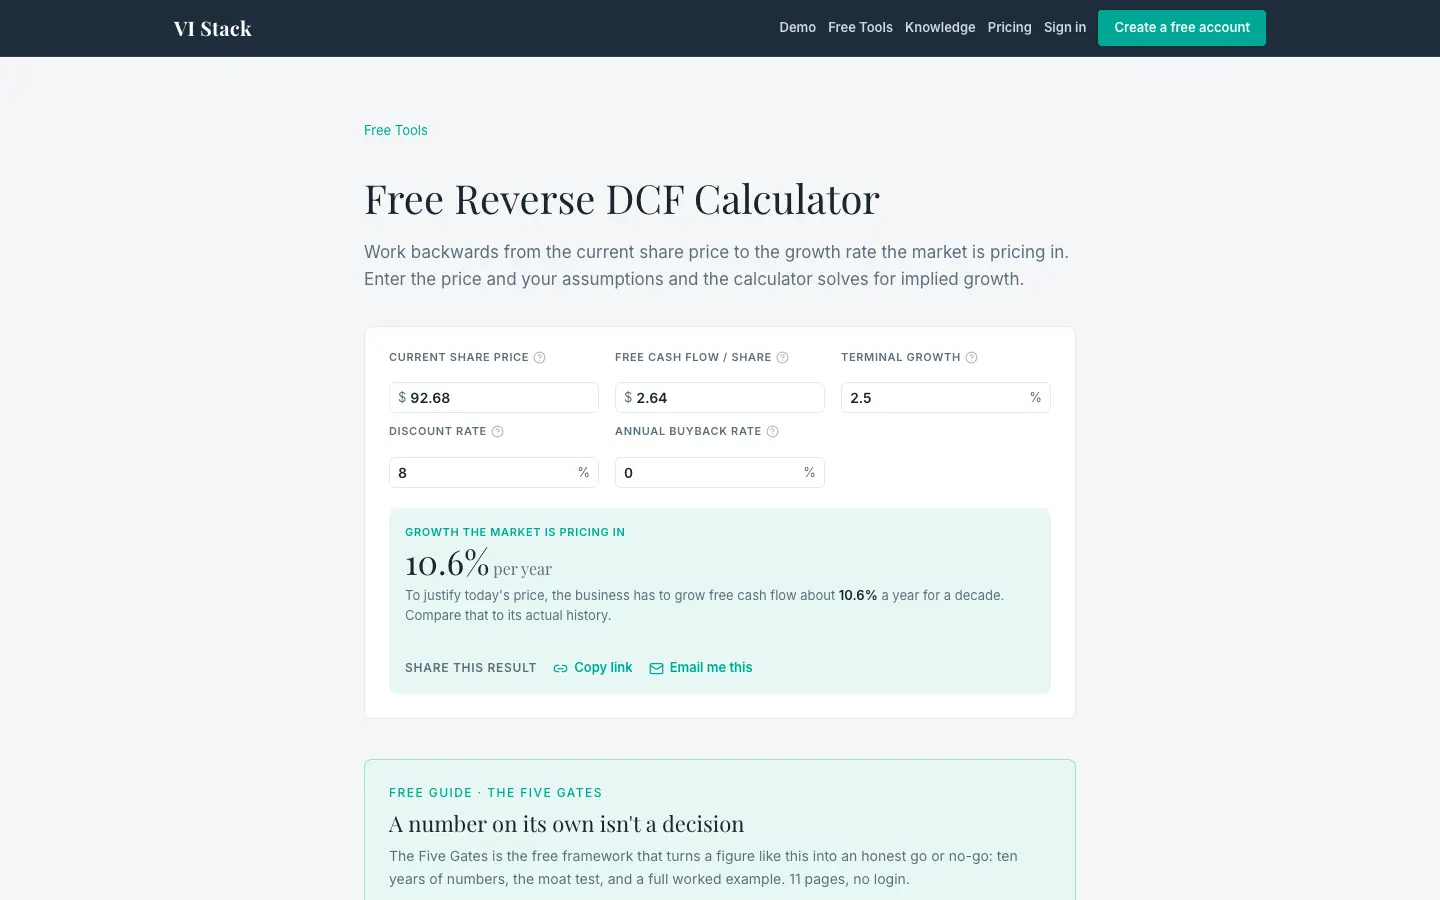
Coca-Cola grew free cash flow 3.6% a year over the past ten years. The price asks for almost three times that. The answer moves with the discount rate: at 7% the price needs 7.9% a year, at 9% it needs 13.1%. None of that proves the stock is expensive, but it tells you exactly what you'd have to believe.
The drawback: you have to bring your own free cash flow figure, and it uses one growth rate for the whole decade. The page also nudges you to hand over your email for a guide.
7. Yield Theory's DCF and reverse DCF calculators (ours)
We publish this guide and these two calculators, so weigh this section accordingly. Our DCF calculator gave Coca-Cola $59.81, the same as Moneychimp, because the math is the same. The reverse DCF calculator said the price needs 10.61% growth a year, matching VI Stack.
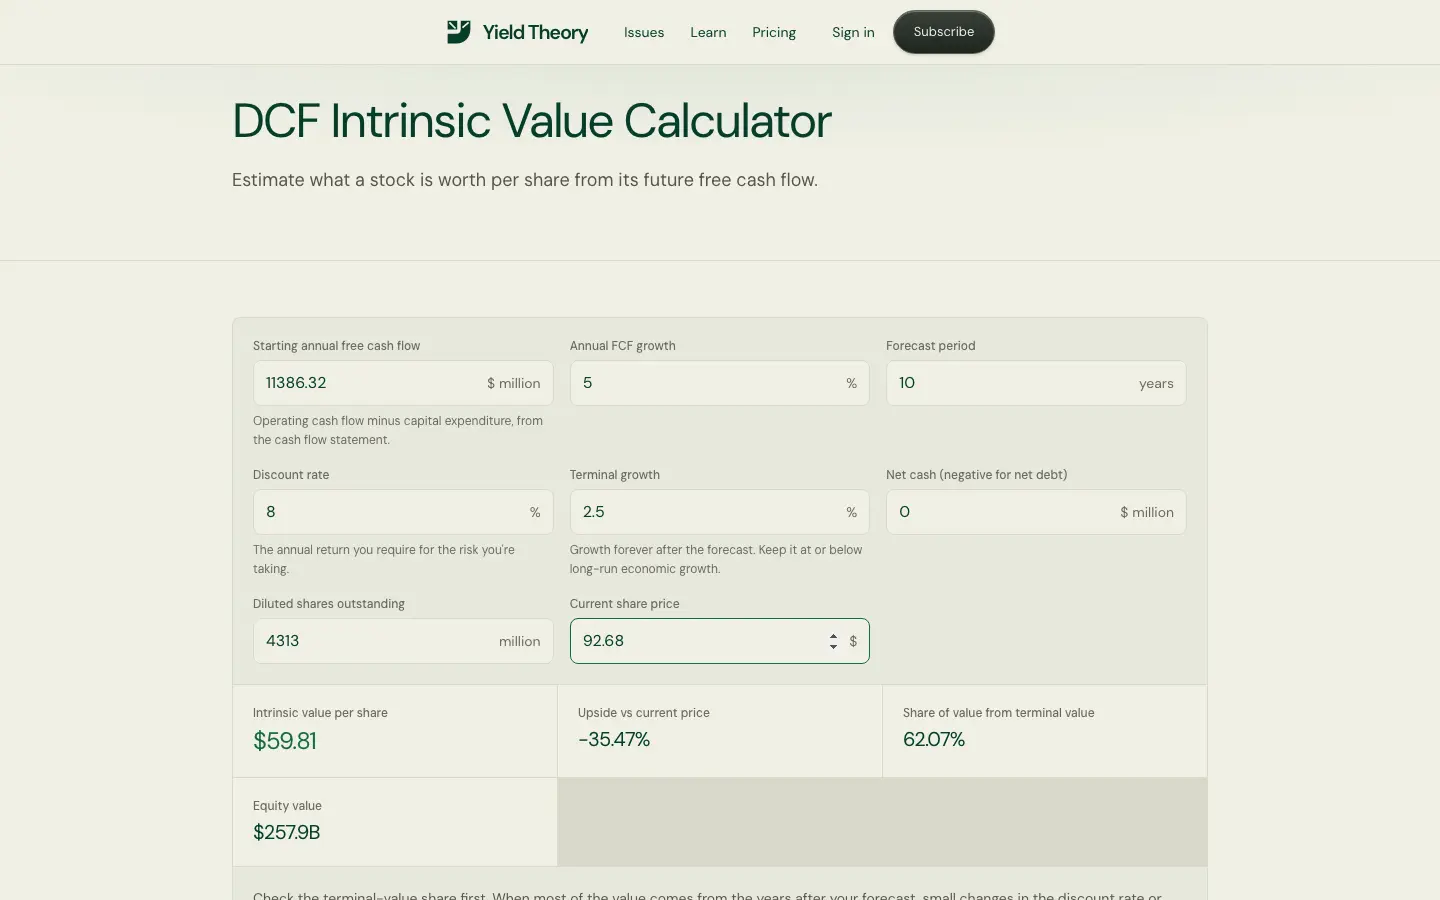
We entered $11,386 million of free cash flow, which is $2.64 times 4,313 million shares, so it started from the same place as the others. Unlike Moneychimp, it also shows how much of the answer comes from the terminal value: 62% here, cash arriving more than ten years out. That share tells you how much the result leans on the far future.
The drawback: you type every input yourself; it loads no company data. It gives one answer per run, with no bear or bull case or sensitivity table, so you rerun it for each scenario. The DCF asks for net cash, which you should leave at zero when your cash flow is already after interest, as here. The reverse DCF works from the market value of the shares alone, so you have to keep debt consistent yourself.
Why do seven calculators disagree on one stock?
Three choices explain almost all of the gap. Most tools make them for you without saying so.
The discount rate
The discount rate is the strongest lever. With our other inputs fixed, moving it from 8% to 6% lifts Coca-Cola's value from $59.81 to $95.39. The tools' own choices range from ValueInvesting.io's 6.0% to the 11% defaults at Moneychimp and Omni.
Same inputs as our test: $2.64 of free cash flow a share, 5% growth for ten years, 2.5% after. Recent price: $92.68.
What happens after the forecast
Identical inputs still produced three answers. Moneychimp and our calculator let cash flow grow forever at 2.5%. Damodaran's sheet makes the company reinvest to earn that growth. Omni stops counting after the years you enter. None of these is the right one; each is a different bet on the far future.
Four tools, identical inputs. The gap comes from how each values the years after the forecast.
The starting cash flow
Start from the wrong year and every tool goes wrong together. Coca-Cola's reported free cash flow of $5.30 billion, or $1.23 a share, includes the one-time fairlife payment. Feed $1.23 into the same DCF and the value falls from $59.81 to $27.86.
Tools that load company data for you can fall into this. We saw it happen with one more free tool, Basis Report's reverse DCF. It loaded Coca-Cola's free cash flow as $5.2 billion and concluded the price needs 25.4% growth a year, at its default 10% discount rate. Our
guide to reading a 10-K shows where one-off items like this hide in the cash flow statement.
The calculators we left out
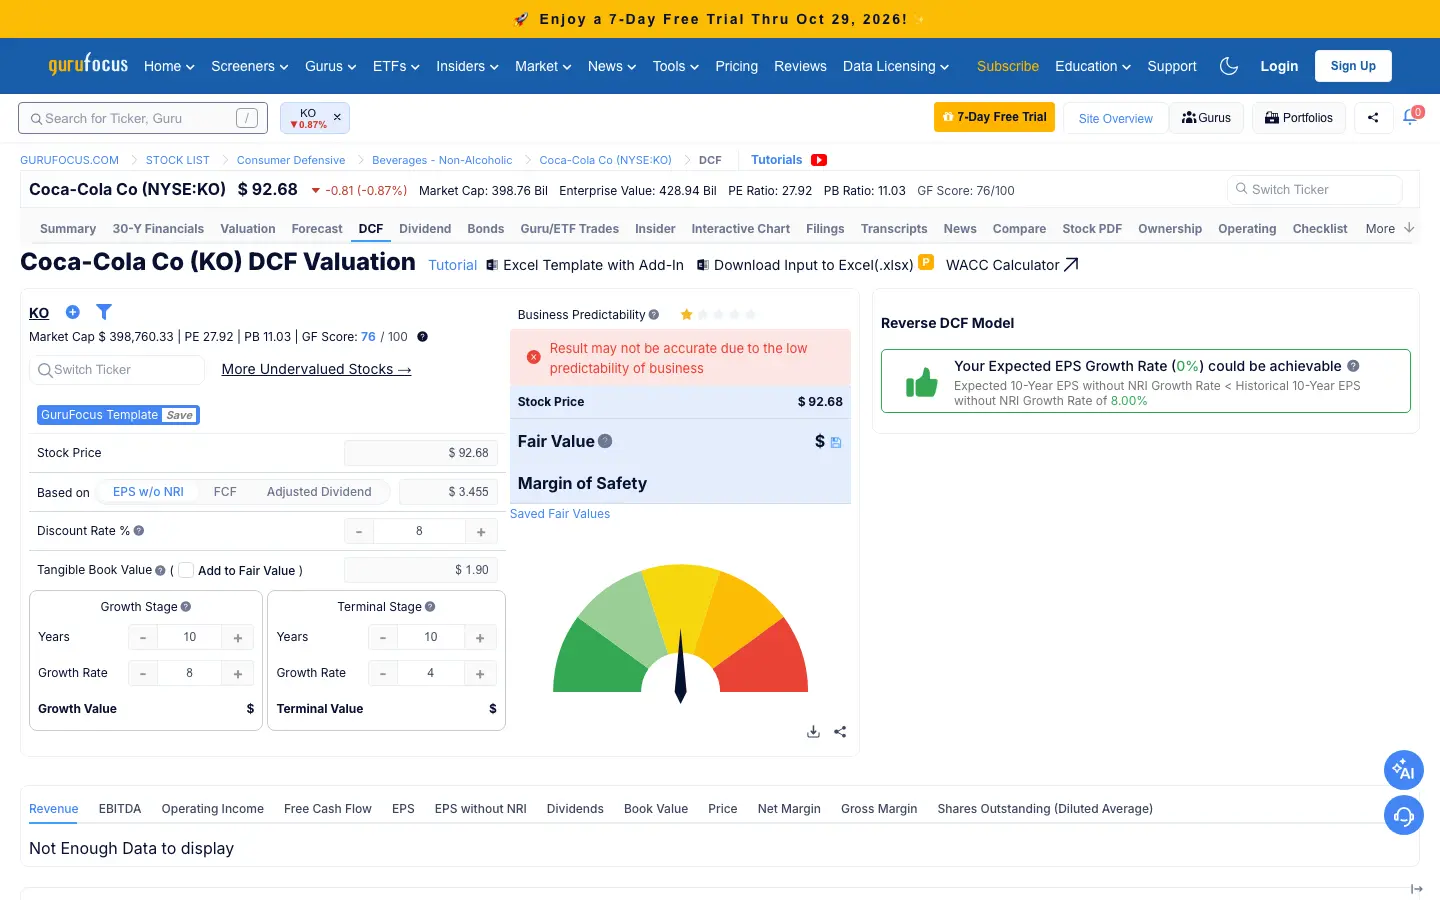
GuruFocus. Its DCF calculator loaded Coca-Cola's defaults without an account: earnings per share of $3.455 excluding one-time items, an 8% discount rate, 8% growth for ten years, then 4% for ten more. But it left the fair value blank. GuruFocus rates Coca-Cola's business predictability one star out of five, and its own FAQ says it doesn't record DCF values for one-star companies. Changing any input also brought up a sign-up prompt. Using the formula GuruFocus publishes on the same page, those defaults give $62.79. We didn't sign up, so we couldn't confirm what a free account shows.
Simply Wall St stopped our browser at a bot check, so we couldn't test it. Our guide to the best stock research websites covers its free tier. Finbox's Coca-Cola model page returned an error, DiscoverCI's site had an expired security certificate, and Stock Unlock's DCF tab didn't load for us without an account.
Our read
Every valuation calculator is a set of assumptions you mostly can't see, and the gap between tools on the same stock proves it. The calculator that agreed with Coca-Cola's price wasn't smarter; it discounted at 6%. So choose by transparency, not by the answer you like. A tool that shows its inputs and lets you change them (Alpha Spread, Damodaran's spreadsheets, Moneychimp or ours) beats a confident number with no workings. Then run a reverse DCF before you trust any output. Our free reverse DCF calculator takes a minute. If the growth the price needs is far above anything the company has done, as with Coca-Cola's 10.6% against 3.6%, you know what you'd have to believe before you buy.
Go deeper with member research
Our member chapter What is the price already assuming? picks up where these calculators stop. It shows how to turn an implied growth rate into the sales growth, margins and reinvestment a company would need, and how to judge whether that's ever happened. It solves for one unknown at a time, so you see which input moves the answer most. It builds a price ladder showing how the burden shifts as the price moves, and it ends with a short "expectations paragraph" you can write for any stock you're weighing.
Keep reading
- 5 ways to calculate the intrinsic value of a stock: a Coca-Cola DCF worked by hand, year by year, plus four other methods.
- 5 formulas to find the fair value of a stock: the Graham number, PEG and yield tests, run across the S&P 500.
- Best stock research websites, by what you need: the free and paid data sites behind your inputs.
Questions readers ask
What is the best free DCF calculator?
For a ready-made model, Alpha Spread: it shows its assumptions and gives bear, base and bull cases. To control every input, use Damodaran's spreadsheets or Moneychimp. Whichever you pick, check its answer with a reverse DCF.
Is the GuruFocus DCF calculator free?
Its DCF page loads without an account and shows the default inputs. For Coca-Cola it left the fair value blank, which its FAQ ties to a one-star predictability rating, and editing an input brought up a sign-up prompt. Its published formula, run on those defaults, gives $62.79.
Is there a free reverse DCF calculator?
Yes. VI Stack's and ours are free with no account. Both solve for the yearly growth that justifies today's price, and both gave Coca-Cola about 10.6% with our inputs.
Is there a free stock valuation calculator in Excel?
Aswath Damodaran's NYU Stern site has dozens of free spreadsheets, from simple two-stage models to his full company valuation workbook. They open in Excel or Apple Numbers.
Why do valuation calculators give different fair values?
They use different discount rates, treat the years after the forecast differently and start from different cash flow figures. Most don't tell you which choices they made, so check the discount rate first.
How we built this
We ran every calculator on 22 October 2026, against Coca-Cola's close of $92.68 on 21 October 2026 from Yahoo Finance's chart data. Coca-Cola's figures come from its 10-K for the year ended 31 December 2025 and its 10-Q for the six months to 3 July 2026. The ten-year cash flow growth compares that year's adjusted free cash flow with the year ended 31 December 2015. The Treasury yield is the 10-year rate for 21 October 2026. We opened Damodaran's fcfe2st.xls in Apple Numbers and computed GuruFocus's value from the formula on its DCF page. The screenshots were taken the same day. Tool outputs change as their data updates.
Companies in this article
Keep reading
Members-only research
Members are reading this
- NVIDIA’s growth has a financing bill
Sales up about 18% on the prior quarter, receivables up about 55%, supply commitments at $279 billion. What NVIDIA’s financing bill means for the price you pay.
- Start here: how Yield Theory approaches research
Yield Theory is independent stock research for people investing their own money. Here is what's free, what members get, and three pieces to read first.
The thesis, the numbers behind it, and what would break it. Full access is $39 a month.
Read the full research