I stopped dumping 10-Ks into a chatbot. The NVIDIA credit issue actually told me which footnote to read.

Priya Mehta
Product manager · Chicago, ILThe depreciation clock piece is the first time someone explained that lag without talking down to me.

Marcus Hale
Accountant · Atlanta, GAJoined for one Micron note. Did four course chapters on the train home. That was not the plan.

Elena Ruiz
Equity analyst · Miami, FLI pick my own stocks and I am slow about it. Fifteen dollars is cheaper than another year of guessing.

Owen Briggs
Retired teacher · Madison, WIThe photonics issue made me draw a map in my notebook. Then I bought the year because I knew I would come back.

Hana Cho
Designer · Brooklyn, NYI like that they show the model breaking. Most research talks like the base case is destiny.

Dev Sharma
Software engineer · Toronto, ONI have an hour after clinic. One chapter, then sleep. I finally finished a 10-K without skimming.

Leila Hassan
Physician · Minneapolis, MNI send the free tools to clients. I keep the member issues for myself.

Ruth Ellison
Advisor · Richmond, VANot a trading feed. Thank god. I read one thing, then I leave it alone for a week.

Jamal Wright
Operator · Houston, TXThe course is not cute. It is long. That is why it worked.

Sofia Rossi
Founder · San Francisco, CAI'm 24 and this is the first research I have finished without Googling every third sentence.

Ben Keller
Grad student · Ann Arbor, MII wanted the archive, not a Discord. This is closer to a desk than a feed.

Keiko Tanaka
Ops · Seattle, WAPower names make more sense once someone walks the capex through to electricity. That GE Vernova write-up stuck.

Luis Ortega
Electrician · Albuquerque, NMSaturday used to be me, three tabs, and a headache. Now I read one issue and close the laptop.

Claire Donovan
Controller · Portland, ORNVIDIA’s growth has a financing bill
- Research desk
- Yield Theory Research
- Reviewed
- Evidence
- 4 external references · Method
Free research issue · September 11, 2026
NVIDIA’s sales rose about 18% from the previous quarter. Over the same three months, the money customers owed it rose about 55%.
That is where this issue starts. The company is securing supply, extending payment terms, and supporting parts of the infrastructure its customers need. Those choices can enable more sales. They also mean that understanding NVIDIA requires more than a forecast of GPU demand.
Our view: the opportunity is becoming more capital-intensive for NVIDIA, even while its operating margins remain exceptional. The key test is whether the additional commitments produce durable, cash-generating demand. We would want the purchase price to work with lower profitability than a straight extrapolation of this quarter.
Below: the cash-flow evidence, the strongest counterargument, the obligations that matter, and a valuation worksheet you can use yourself.
The case in three lines
- What supports it: demand growth and operating profitability are substantial; major buyers such as Microsoft also generate substantial operating cash.
- What needs scrutiny: receivables, customer support arrangements, and commitments are expanding alongside sales.
- What would change our view: improving collections and independently funded customer demand would strengthen the case. Persistent cash absorption combined with growing support obligations would weaken it.
This is a business-quality assessment and a valuation framework, not a buy or sell call.
1. Start with the reported business
Research cutoff: September 11, 2026. The figures below cover the quarter ended July 26, reported August 26. All amounts are US dollars.
| NVIDIA, Q2 FY2027 | Reported result |
|---|---|
| Revenue | $96.221 billion |
| Revenue growth vs. the same quarter a year earlier | 106% |
| GAAP gross margin | 75.0% |
| GAAP operating income | $63.734 billion |
| GAAP net income | $59.688 billion |
| Operating cash flow | $24.077 billion |
| Diluted weighted-average shares | 24.285 billion |
Source: NVIDIA’s August 26 earnings release, income statement and cash-flow tables. The 106% compares with the same quarter a year earlier; the 18% in the opening compares with the previous quarter. The next-quarter revenue outlook was $108 billion, plus or minus 2%; that is guidance, not a completed result.
Revenue is the amount sold. Operating income subtracts the cost of producing and running the business. Net income also reflects taxes and non-operating items. Cash flow asks what actually moved through the bank account from operations.
Those measures answer different questions. Start by keeping them separate.
2. The number worth a second look: cash conversion
The quarter’s operating cash flow was about 40% of net income: $24.077 billion divided by $59.688 billion. The release also shows a $22.346 billion cash outflow from rising receivables and a $7.771 billion adjustment removing equity-security gains from operating cash flow. These are different effects: collecting customer payments takes time, while investment gains are not chip-sales cash receipts. Source: cash-flow statement.
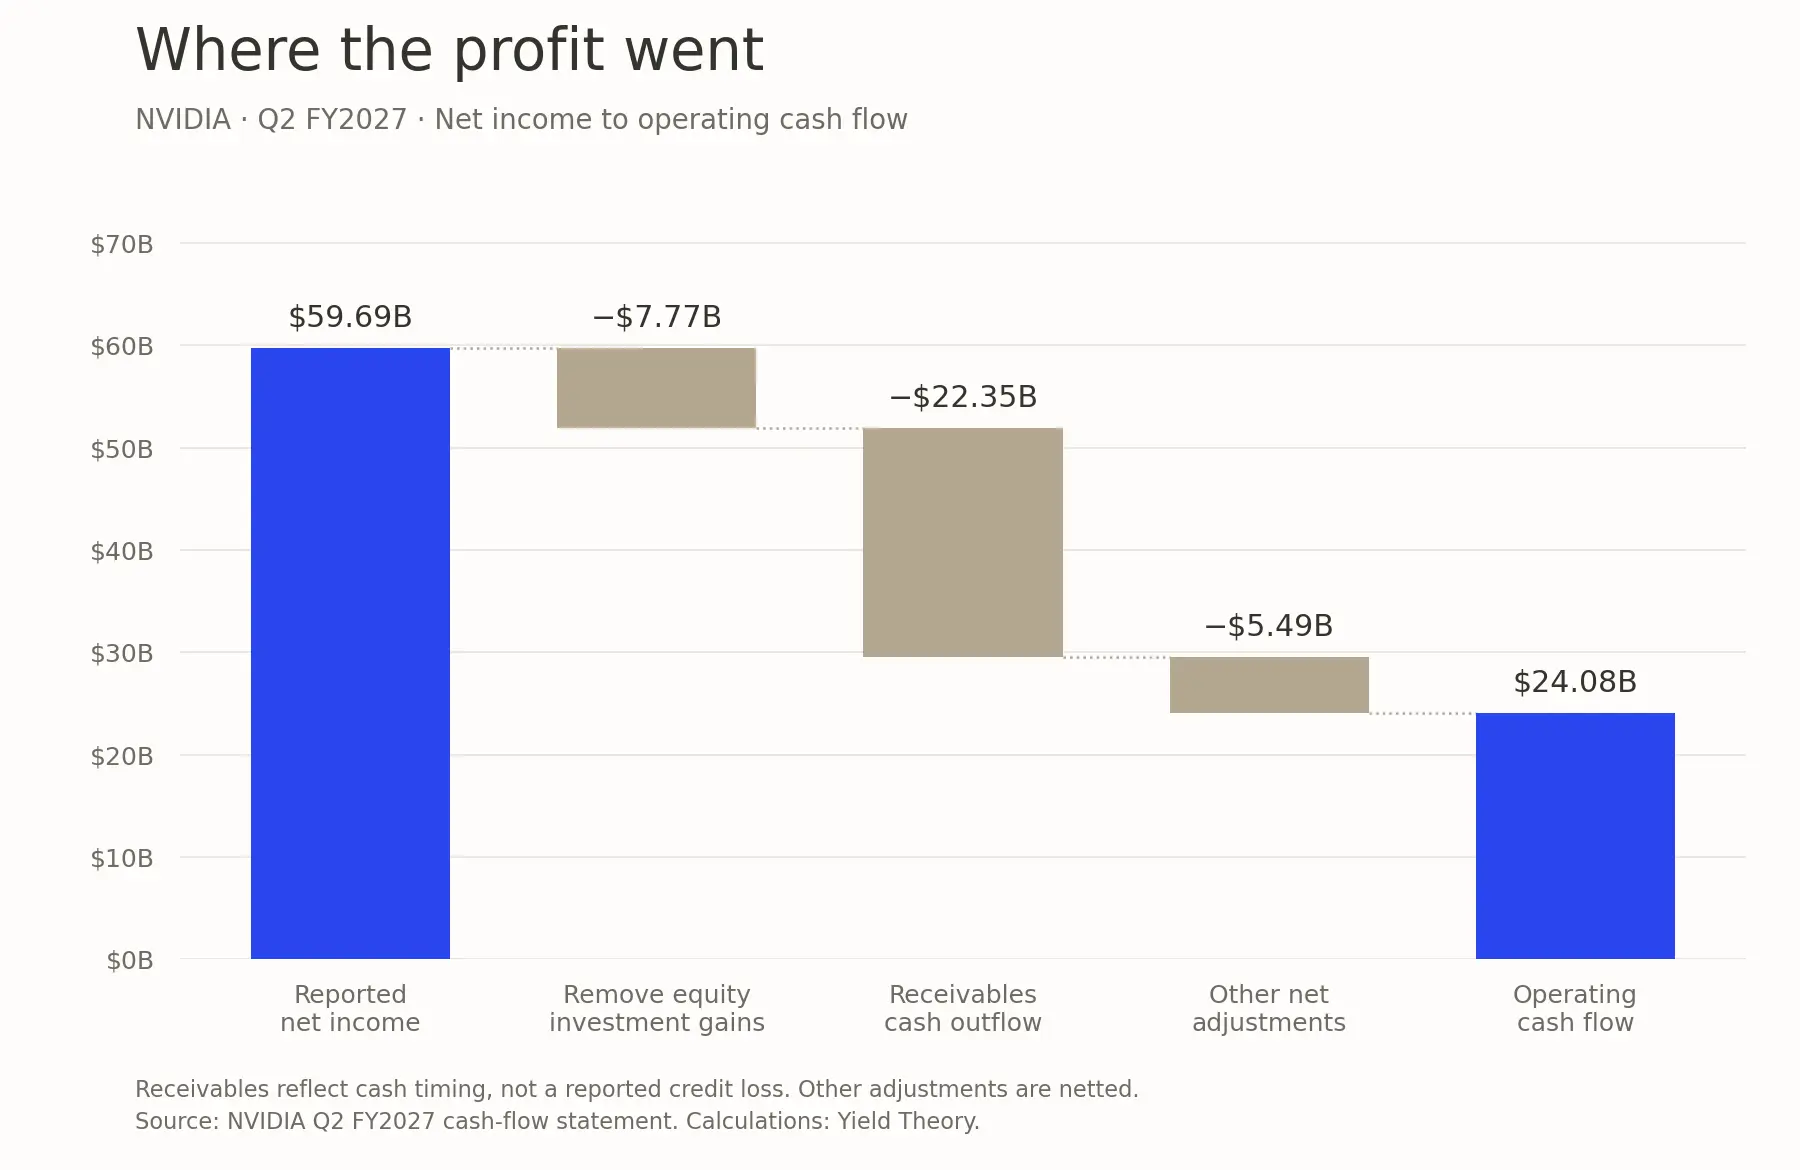
The bridge reconciles reported net income to operating cash flow. Receivables are a use of cash, not an asserted loss. Other net adjustments include all remaining reconciling items.
Compare two quarters before drawing the conclusion
| Measure | Q1 FY2027 | Q2 FY2027 | Change from Q1 |
|---|---|---|---|
| Revenue | $81.615bn | $96.221bn | +17.9% |
| Closing receivables | $40.710bn | $63.059bn | +54.9% |
| Operating cash flow | $50.344bn | $24.077bn | −52.2% |
| Operating cash / net income | 86.3% | 40.3% | Lower conversion |
| Closing receivables / quarterly revenue × 91 | 45.4 days | 59.6 days | +14.2 days |
Source inputs: Q1 financial statements and the Q2 release above. Changes and ratios are our calculations. The last row is a simple end-balance collection proxy, not reported DSO: it assumes 91 days and cannot adjust for the timing of shipments within each quarter.
A growth company can ship heavily near quarter-end and collect later. The proxy does not tell us how much receivables are overdue, which customer owes what, or whether a balance is impaired.
But there is a more specific explanation to investigate. NVIDIA’s 10-Q, Liquidity and Capital Resources, says extended payment terms for certain investment-grade customers under large, multi-quarter agreements will continue to affect operating cash-flow timing.
Our interpretation: part of the gap can reflect the commercial terms needed to deliver growth. Investment-grade customers can be creditworthy and still tie up the supplier’s cash. Credit risk and payment timing are separate questions.
Give the bullish explanation a fair test
Across the first half, operating cash flow totaled $74.421 billion against $118.010 billion of GAAP net income, a 63.1% conversion ratio. The longer window is better than Q2 alone, although it still contains investment gains and working-capital movements. Do not subtract the equity gains twice: the cash-flow statement already removes them when reconciling net income to cash.
The right follow-up is collection performance over several quarters, adjusted for sales growth and shipment timing. A recovery would undermine the claim that this quarter signals lasting deterioration. We do not have customer-level payment schedules, aging, or enough subsequent results to settle that question today.
3. Three commitments investors should keep separate
The 10-Q’s Note 10 describes the following arrangements:
| Arrangement | Disclosed amount | What it represents |
|---|---|---|
| Supply and capacity | $279bn, up from $119bn last quarter | Multi-year procurement commitments; some agreements can be adjusted, potentially at a cost |
| AI cloud agreements | $36bn | Capacity commitments that decrease as capacity is used by NVIDIA or third parties |
| SB Energy credit support, signed in August | Up to $105bn | Conditional guarantees that phase in with construction; first phase expected in FY2029 |
The guarantee covers defined lease and power obligations following specified tenant defaults. It is not $105 billion paid today, a booked loss, or all the cost of the site. The filing describes termination conditions and NVIDIA infrastructure exclusivity, with limited exceptions.
Do not add these amounts together and call the sum debt. Procurement, capacity support, and contingent guarantees have different timing, offsets, and loss mechanisms.
Here is the economic connection we think matters:
- Securing supply can protect NVIDIA’s ability to deliver.
- Giving customers more time to pay can help them accept those deliveries.
- Supporting infrastructure can make room to deploy the equipment.
- The return depends on that infrastructure ultimately earning enough from end users.
This can deepen the platform’s position. It can also leave the supplier exposed at more points in the same investment cycle. If demand disappoints, collections, supply utilization, and customer support could come under pressure together.
That is a correlated risk, not a claim that reported sales are fictitious. Public filings don’t let us put credible loss probabilities on each arrangement, so we don’t try.
Member research: Payment terms and credit support are only part of NVIDIA’s financing role. Issue 05 follows how NVIDIA turns roadmap knowledge into cheaper capital for customers, and how AI infrastructure financing is moving into private credit, insurance balance sheets and securitized debt.
4. The strongest counterargument: some buyers can fund the bill
A blanket claim that the buildout depends entirely on fragile financing does not fit Microsoft’s results.
For the quarter ended June 30, Microsoft reported $55.441 billion of operating cash flow and $35.802 billion of cash additions to property and equipment. Subtracting the latter leaves $19.639 billion. Azure and other cloud services revenue grew 43% year over year. Source: Microsoft FY2026 Q4 results.
That residual is a narrow operating-cash-minus-cash-capex measure that ignores financing-lease commitments and other cash uses. It comes from Microsoft’s whole business, so it doesn’t show the return on AI spending or on NVIDIA purchases specifically.
They do establish something useful: a large infrastructure buyer has a substantial internal funding engine. The investment question is therefore which customers can finance repeat purchases, and on what terms, rather than whether every AI customer has the same economics.
We would segment demand by funding source: established cash-generating platforms, externally financed infrastructure companies, and model developers whose plans depend on continued capital access. Avoid treating a direct-customer count as a complete picture of underlying demand.
5. Put a price on three different futures
The following is an intentionally simple earnings model. It estimates a share value one year from the research date, using an assumed annual earnings level at that point. It is not a full discounted cash-flow model or a forecast of reported FY2028 results.
We hold diluted shares at 24.3 billion, rounded from the reported quarter. Revenue, net margin, and price-to-earnings multiples are our scenario choices. We do not assume buybacks will rescue the calculation.
| Assumption or output | Slower growth | Middle case | Strong execution |
|---|---|---|---|
| Annual revenue assumption | $400bn | $500bn | $600bn |
| Net profit margin assumption | 40% | 50% | 55% |
| Net income: revenue × margin | $160bn | $250bn | $330bn |
| Diluted shares, held constant | 24.3bn | 24.3bn | 24.3bn |
| Earnings per share | $6.58 | $10.29 | $13.58 |
| Assumed earnings multiple | 22× | 28× | 32× |
| Implied share value in one year | $144.86 | $288.07 | $434.57 |
| Present value at a 10% required return | $131.69 | $261.88 | $395.06 |
Calculations use unrounded inputs. The last row divides the one-year value by 1.10. The 10% return is an illustrative hurdle, not a promised return. Dividends are excluded. Net income already includes interest expense; this P/E approach does not separately add cash or subtract debt.
Anchor the assumptions to the business
Revenue: four times Q3’s $108 billion revenue guidance is $432 billion. It is a run-rate reference, not a full-year forecast. The $400 billion case sits below it; $500 billion is about 16% above it; $600 billion requires about 39% more. That makes the operating hurdle visible.
Margins: applying a hypothetical 17% tax rate to Q2 operating income, with zero net non-operating income, produces roughly a 55% net margin. This strips out the benefit of investment gains by construction, but also simplifies interest and other items. It is our normalization, not NVIDIA’s adjusted earnings. The strong case broadly preserves that margin; the other cases compress it to 50% and 40%.
Multiples: 22×, 28×, and 32× are sensitivity assumptions, not observed market multiples. A richer multiple requires confidence in growth beyond the modeled year. The middle case is a reference point, not a probability forecast.
The model also does not explicitly price contingent guarantee losses or future working-capital funding. If those become material, an earnings multiple alone is inadequate: model the cash outflows and financing separately. Do not deduct full procurement commitments from equity value while also charging the associated product costs to earnings.
The wide range is useful. It tells you that “AI demand will grow” is nowhere near a complete investment thesis.
The margin assumption can do more work than you think
Keep revenue at $500 billion and the multiple at 28×. Change only the net margin:
| Net margin | One-year implied share value |
|---|---|
| 40% | $230.45 |
| 45% | $259.26 |
| 50% | $288.07 |
| 55% | $316.87 |
A five-percentage-point margin change moves the modeled value by about $28.81 per share. Revenue has not changed at all.
Now hold the 50% margin and cut the multiple from 28× to 22×. The one-year value falls from $288.07 to $226.34. A business can meet your earnings assumption and still miss your return hurdle if investors pay less for those earnings.
This is why the purchase price belongs in the thesis. Revenue growth alone cannot tell you whether you are being paid for the risk.
6. Work backward from the price you would pay
Try a hypothetical $250 entry price, a 10% one-year required return, and a 28× exit multiple. Again, $250 is a worksheet input, not the current share price.
- Required one-year value: $250 × 1.10 = $275.
- Required earnings per share: $275 ÷ 28 = $9.82.
- Required annual net income: unrounded EPS × 24.3 billion shares = $238.66 billion.
- At a 50% net margin, required annual revenue = $477.32 billion.
- At a 40% net margin, required annual revenue rises to $596.65 billion.
Same entry price. Same desired return. Very different operating requirements.
For context, four times the reported quarter’s revenue is $384.884 billion. That is a mechanical annualization, not a revenue forecast. The $477.32 billion requirement is roughly 24% above that baseline; the $596.65 billion requirement is roughly 55% above it.
Replace $250 with your own test price. Then ask whether you can support the required sales and profitability with evidence. If you cannot explain those inputs, you have found the next piece of research to do.
Download the valuation worksheet
The CSV opens in a spreadsheet. It includes editable assumptions and formulas for all three cases and the reverse-price exercise. Change the inputs to see which part of your thesis carries the most weight.
7. The next-filing scorecard
Strong growth deserves attention, but the cash and commitment disclosures justify stress-testing the earnings story. These checks would move our assessment either way:
| Check | Evidence that strengthens the case | Evidence that calls for a revision |
|---|---|---|
| Customer collections | Collection proxy improves from 59.6 days and cash conversion recovers | Receivables outgrow sales again with no convincing timing explanation |
| Profitability | Margins hold as the business expands | Discounts or costs erode the margin you modeled |
| Buyer economics | Repeat orders are supported by customer operating cash | Revenue requires more financing or guarantee support per unit of demand |
| Commitments | Disclosed capacity obligations run off as third parties use capacity | Unused capacity or delayed lease transfers leave NVIDIA carrying more cost |
| Valuation | The price works with assumptions you can defend | The return depends on both peak margins and a richer multiple |
Write down the evidence you need and revisit it with each filing. Changing your mind in response to new information is part of the work.
Your five-minute investment memo
Copy this into a note before researching your next stock:
- The business: It earns money by ______, and customers choose it because ______.
- My test price: At $______ per share, I need annual revenue of $______ and a net margin of ______% to support my return hurdle.
- The evidence: The two filings or operating measures that support those assumptions are ______.
- The weak point: The assumption doing the most work is ______.
- My next check: I will revisit the case when ______. Evidence that would change my view is ______.
If you can fill those lines with numbers and sources, you have moved beyond a stock story. You have a case you can examine.
Questions readers ask
Is the 18% growth the same as the 106%?
No. The 18% compares Q2 revenue of $96.221 billion with Q1’s $81.615 billion, a 17.9% rise in three months. The 106% compares Q2 with the same quarter a year earlier. Both are real; they answer different questions.
Do rising receivables mean customers aren’t paying?
Not necessarily. The 10-Q points to extended payment terms for certain investment-grade customers under large, multi-quarter agreements. Our 59.6-day proxy can’t show overdue or impaired balances, so the useful test is whether collections improve over the next few quarters.
Is the $105 billion SB Energy guarantee debt?
No. It is conditional credit support that phases in with construction (first phase expected in FY2029) and covers defined lease and power obligations after specified tenant defaults. Adding it to the $279 billion of supply commitments and calling the total debt would mix obligations with different timing and loss mechanisms.
Take the next question further
This issue shows why customer financing belongs in the valuation conversation. Our paid research follows the mechanisms behind those investment questions in greater depth.
Our member issue, NVIDIA Is Building the Credit Market for AI, examines that financing mechanism. Who keeps the profits from AI’s photonics buildout? follows the opportunity into the supply chain. Both links open member-issue previews.
Want to build these cases yourself? The fundamental research course walks through filings, financial statements, valuation, risks, and your first memo in 40 chapters with exercises.
Membership includes both: the research archive and the course. $39/month or $249/year.
Member issue · Aug 12, 2026
Issue 05: NVIDIA Is Building the Credit Market for AI
NVIDIA has found a way to turn knowledge of its own roadmap into a lower cost of capital for its customers. The result could move AI infrastructure from venture equity into private credit, insurance balance sheets and securitized debt.
Inside the issue
- The $500 billion headline is not the deal
- Executive judgment
- Jensen found the invisible bottleneck
- The GPU is only one layer of the collateral
- The cost of GPU credit has already collapsed
About 24 minutes · 18 cited sources