Yield Theory
← Learning library

The investor's field guide · Full course

Fundamental research, from the ground up

Read the business. Work the numbers. Challenge the valuation. Build your judgment with detailed chapters, interactive models, and explanations you can play through step by step.

24 chapters

6 modules · 33.2k words
~5 hours with practice
A model and visual walkthrough in every chapter

Work at your own pace. Reading estimates use 180 words per minute plus practice time.

Inside the course · a visual lesson

Visual field notes · Worked example

A better business can still be a worse investment

Index: year 0 = 100. Hypothetical teaching data, not a forecast or market history.

A better business can still be a worse investmentIndex: year 0 = 100. Earnings per share: Year 0 100, Year 1 110, Year 2 121, Year 3 133.1. Share price: Year 0 100, Year 1 99, Year 2 96.8, Year 3 93.17050100150Year 0: Earnings per share 100Year 1: Earnings per share 110Year 2: Earnings per share 121Year 3: Earnings per share 133.1Year 0: Share price 100Year 1: Share price 99Year 2: Share price 96.8Year 3: Share price 93.17Year 0Year 1Year 2Year 3
Earnings per shareShare price
READ THE PICTURE · 1

Separate the two engines

Start with a business earning $1 per share and a stock trading at $30. Earnings grow 10% each year, reaching $1.331 in year three. The blue line tracks that operating progress. It answers a business question: is each share earning more? It does not yet tell you what an investor receives.

READ THE PICTURE · 2

Watch the price investors pay

The earnings multiple falls from 30× to 27×, then 24× and 21×. Multiplying earnings by those prices gives $30, $29.70, $29.04 and $27.951. Both lines start at an index of 100 so you can compare their percentage changes. The company improves while the shareholder loses money before dividends.

READ THE PICTURE · 3

Translate the picture into a thesis

A forecast needs both earnings and a purchase price. Paying a high multiple can mean that substantial future progress is already expected. The right question is not simply whether the business will grow. Ask how much growth your entry price requires and what evidence would justify a different future multiple.

View the chart data
Index: year 0 = 100
Period / categoryEarnings per shareShare price
Year 0100100
Year 111099
Year 212196.8
Year 3133.193.17

Included with membership

Build your own investment judgment.

Unlock the complete course, interactive financial models, practice answers, and animated explainers, alongside every paid Yield Theory issue.

$15/month or $150/year. No separate course fee.

Your curriculum

MODULE 1

Foundations

Learn what you own and where evidence comes from.

  1. 01

    Think like an owner

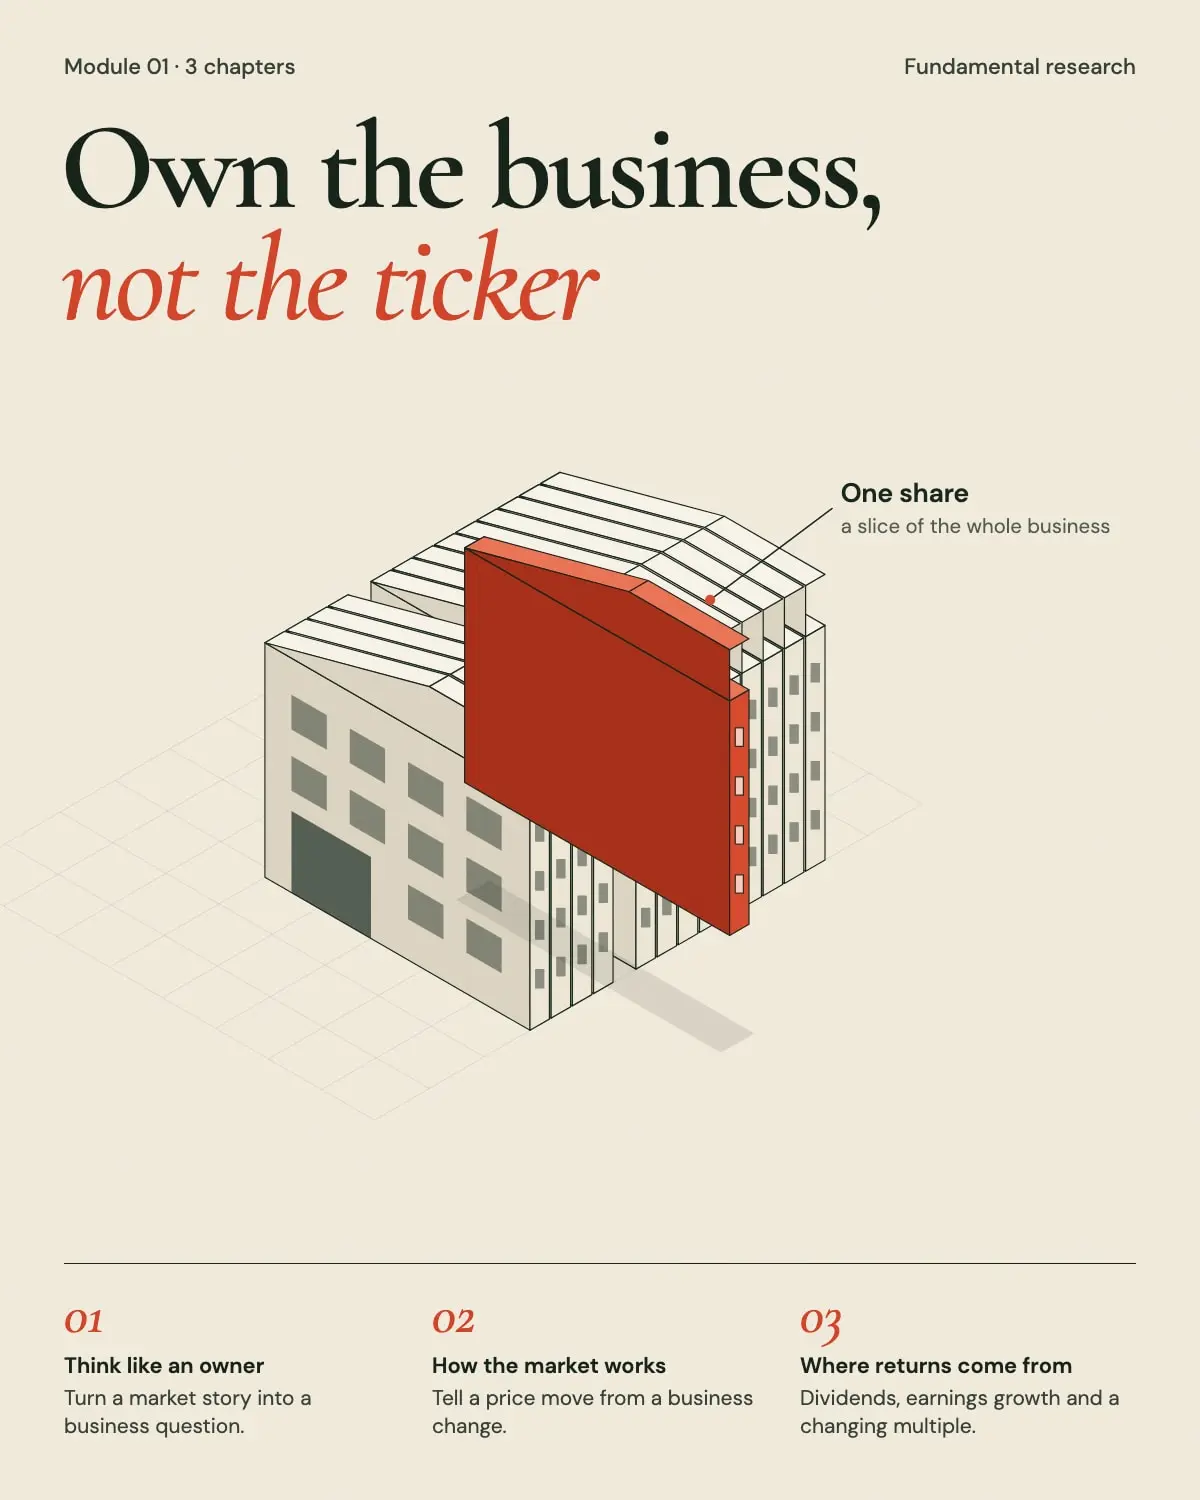
    Turn a stock-market story into a testable business question.

    12 min · Interactive model · Free sample

  2. 02

    Map an industry and its business models

    Identify the customer, profit pool, value chain, and real competitors.

    13 min · Interactive model · Members

  3. 03

    Find the evidence in US filings

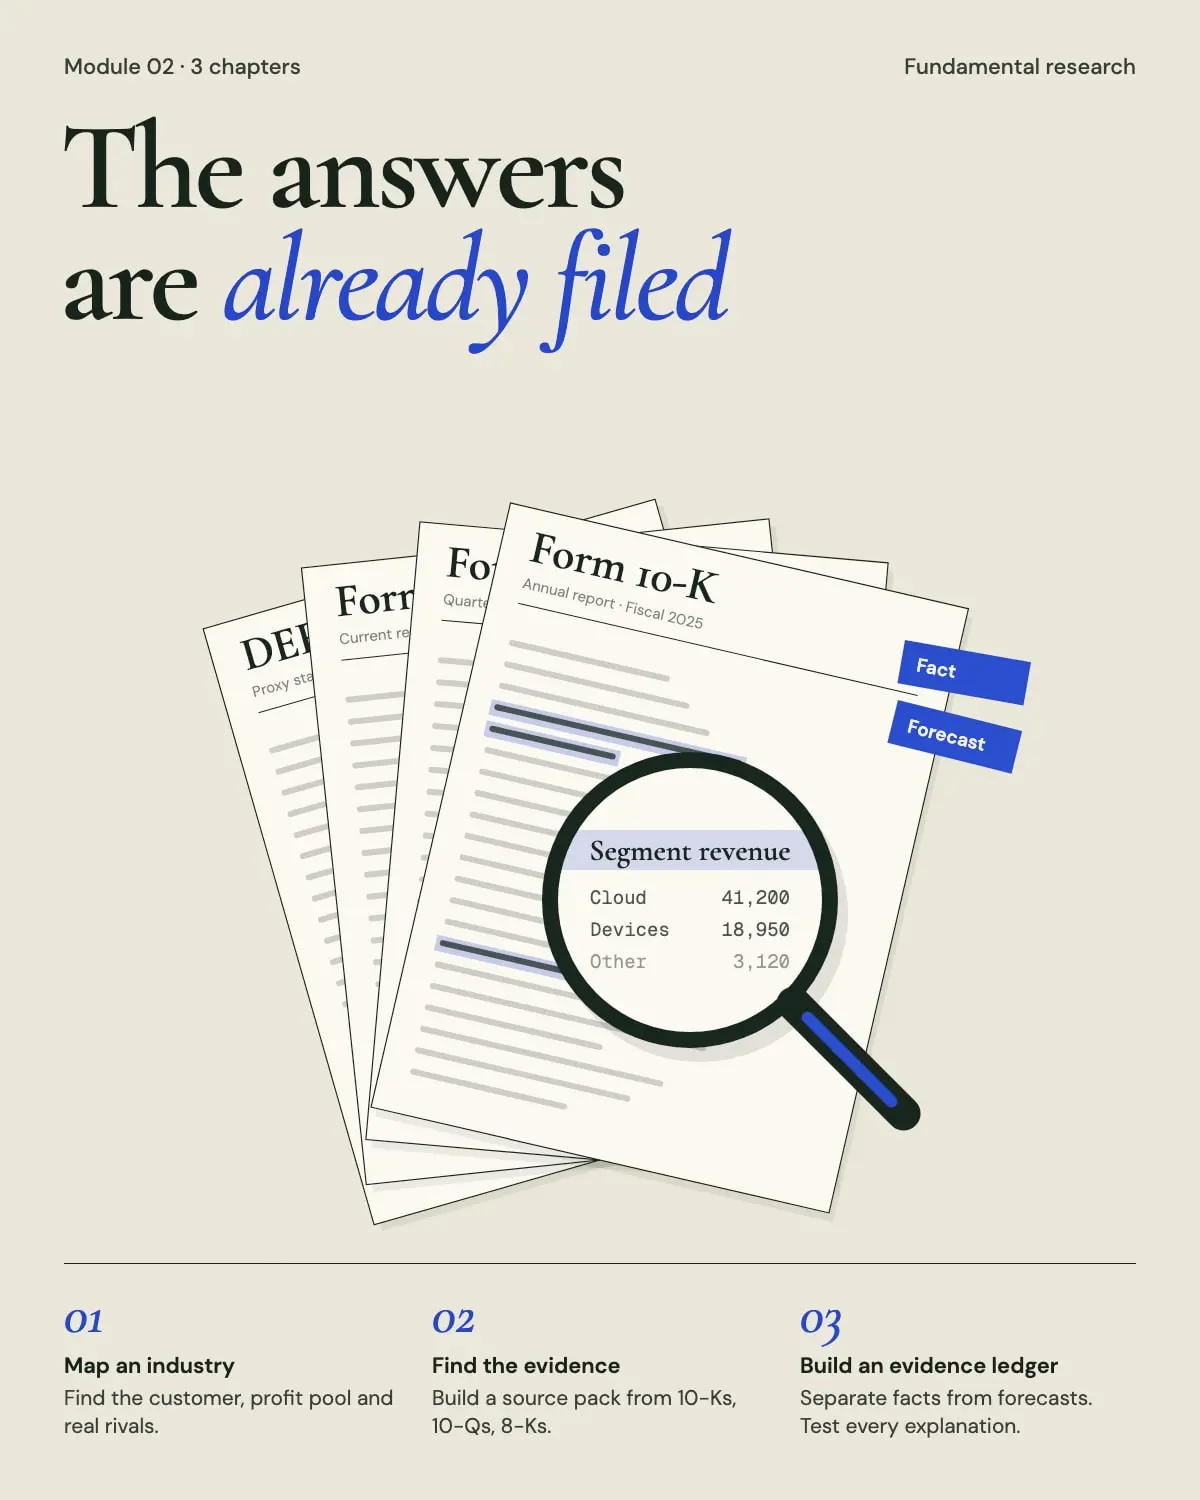
    Build your source pack with 10-Ks, 10-Qs, 8-Ks, and proxy statements.

    12 min · Interactive model · Members

  4. 04

    Build an evidence ledger

    Separate facts from forecasts, test competing explanations, and resist confirmation bias.

    13 min · Interactive model · Members

MODULE 2

The statements

Connect sales, profits, cash, and the balance sheet.

  1. 05

    Follow the dollar through the business

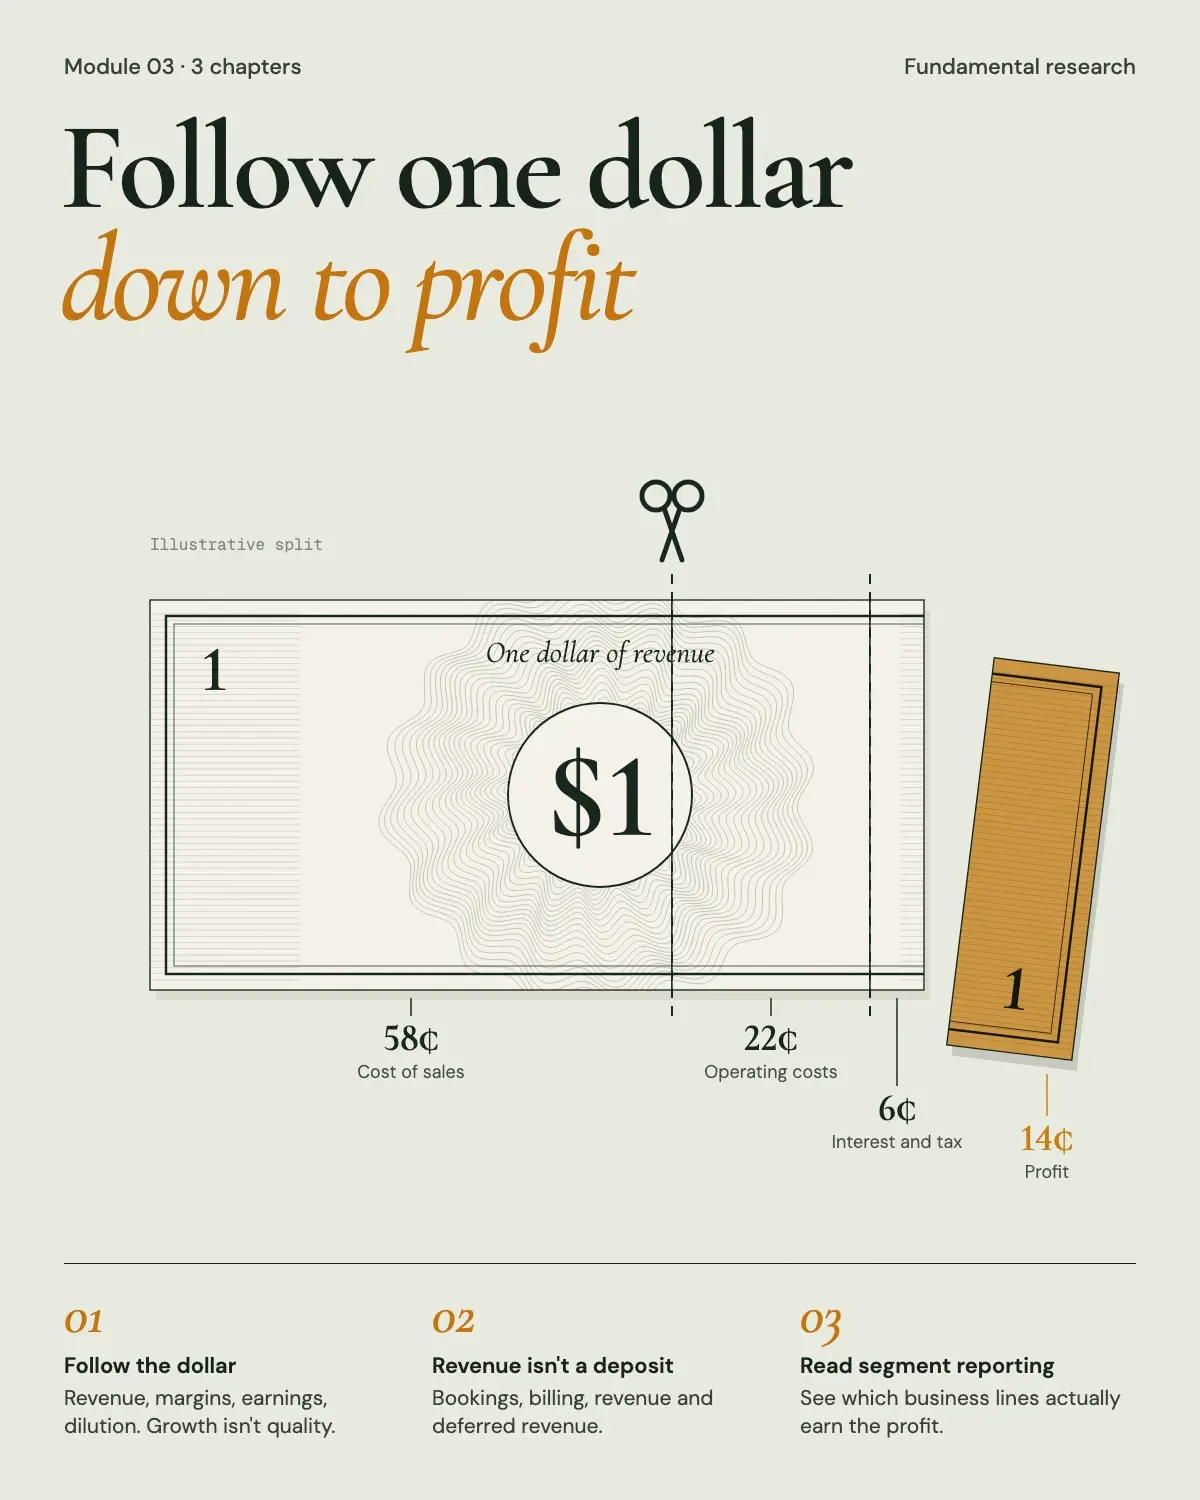
    Read revenue, margins, earnings, and dilution without confusing growth with quality.

    12 min · Interactive model · Members

  2. 06

    Revenue is not a bank deposit

    Follow a service contract through bookings, billing, revenue, and deferred revenue.

    12 min · Interactive model · Members

  3. 07

    Check whether the earnings become cash

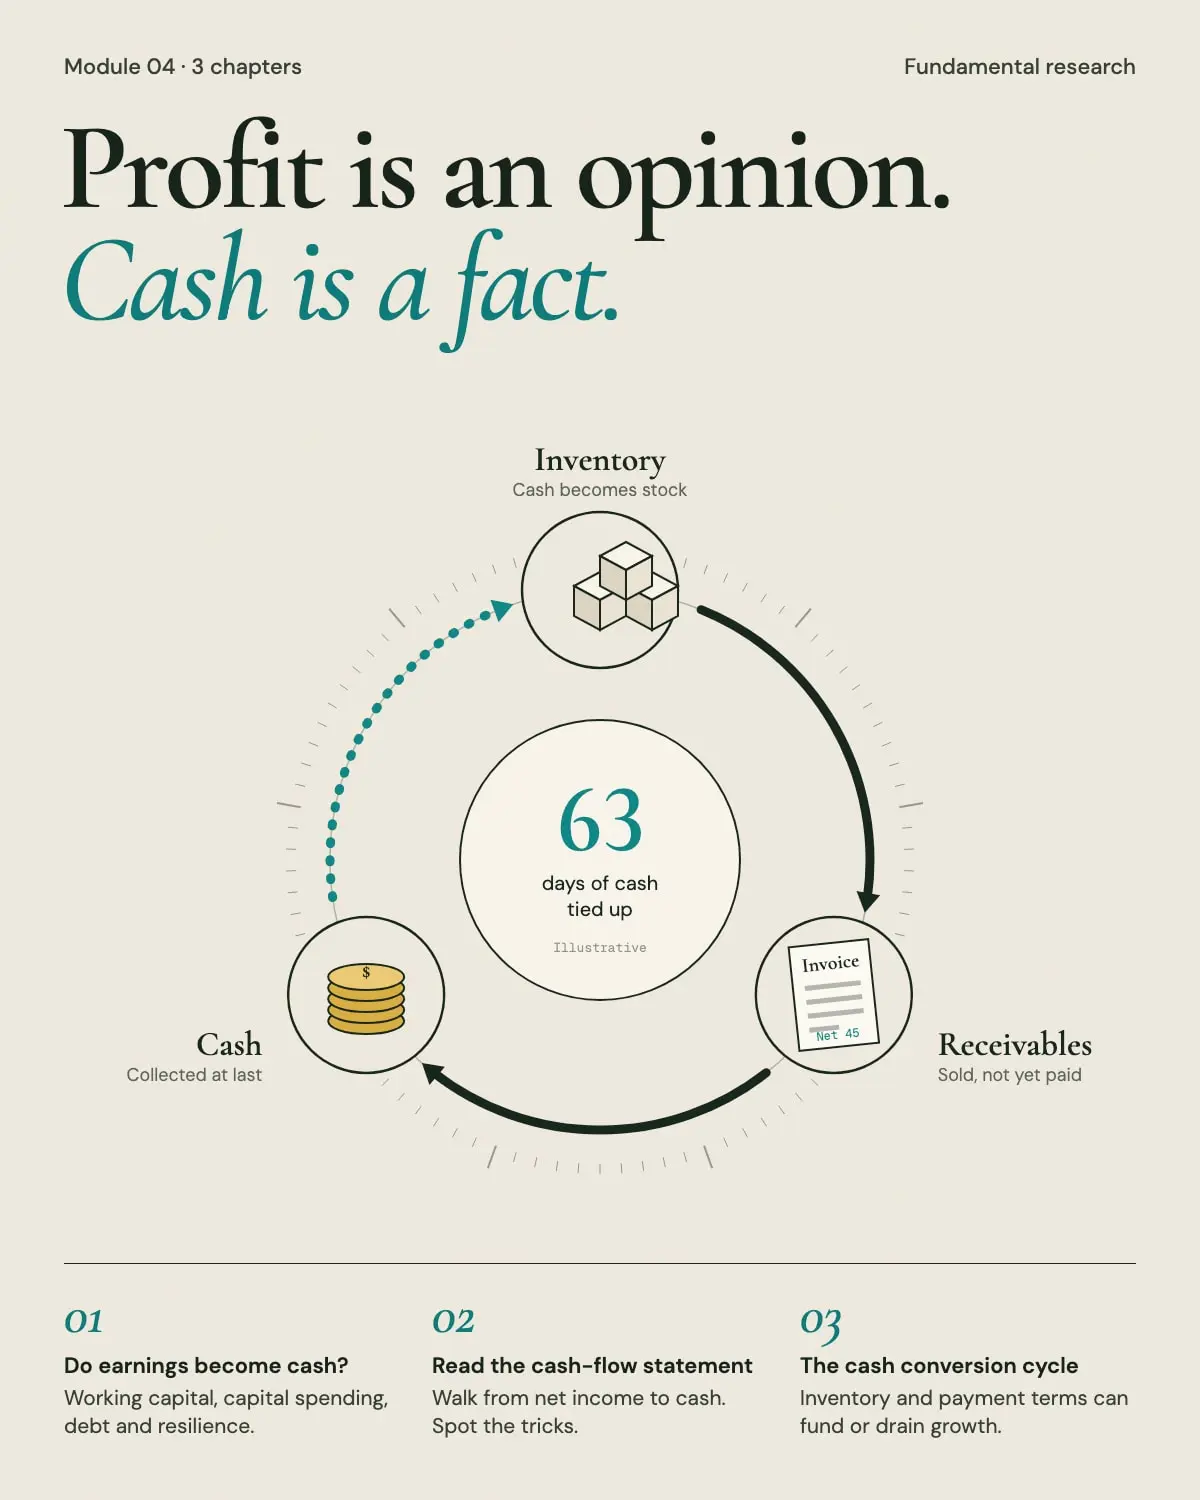
    Connect working capital, capital spending, debt, and financial resilience.

    12 min · Interactive model · Members

  4. 08

    The cash conversion cycle

    See how inventory and customer payment terms can finance or consume growth.

    12 min · Interactive model · Members

MODULE 3

Business economics

Test cash quality, financing resilience, and unit economics.

  1. 09

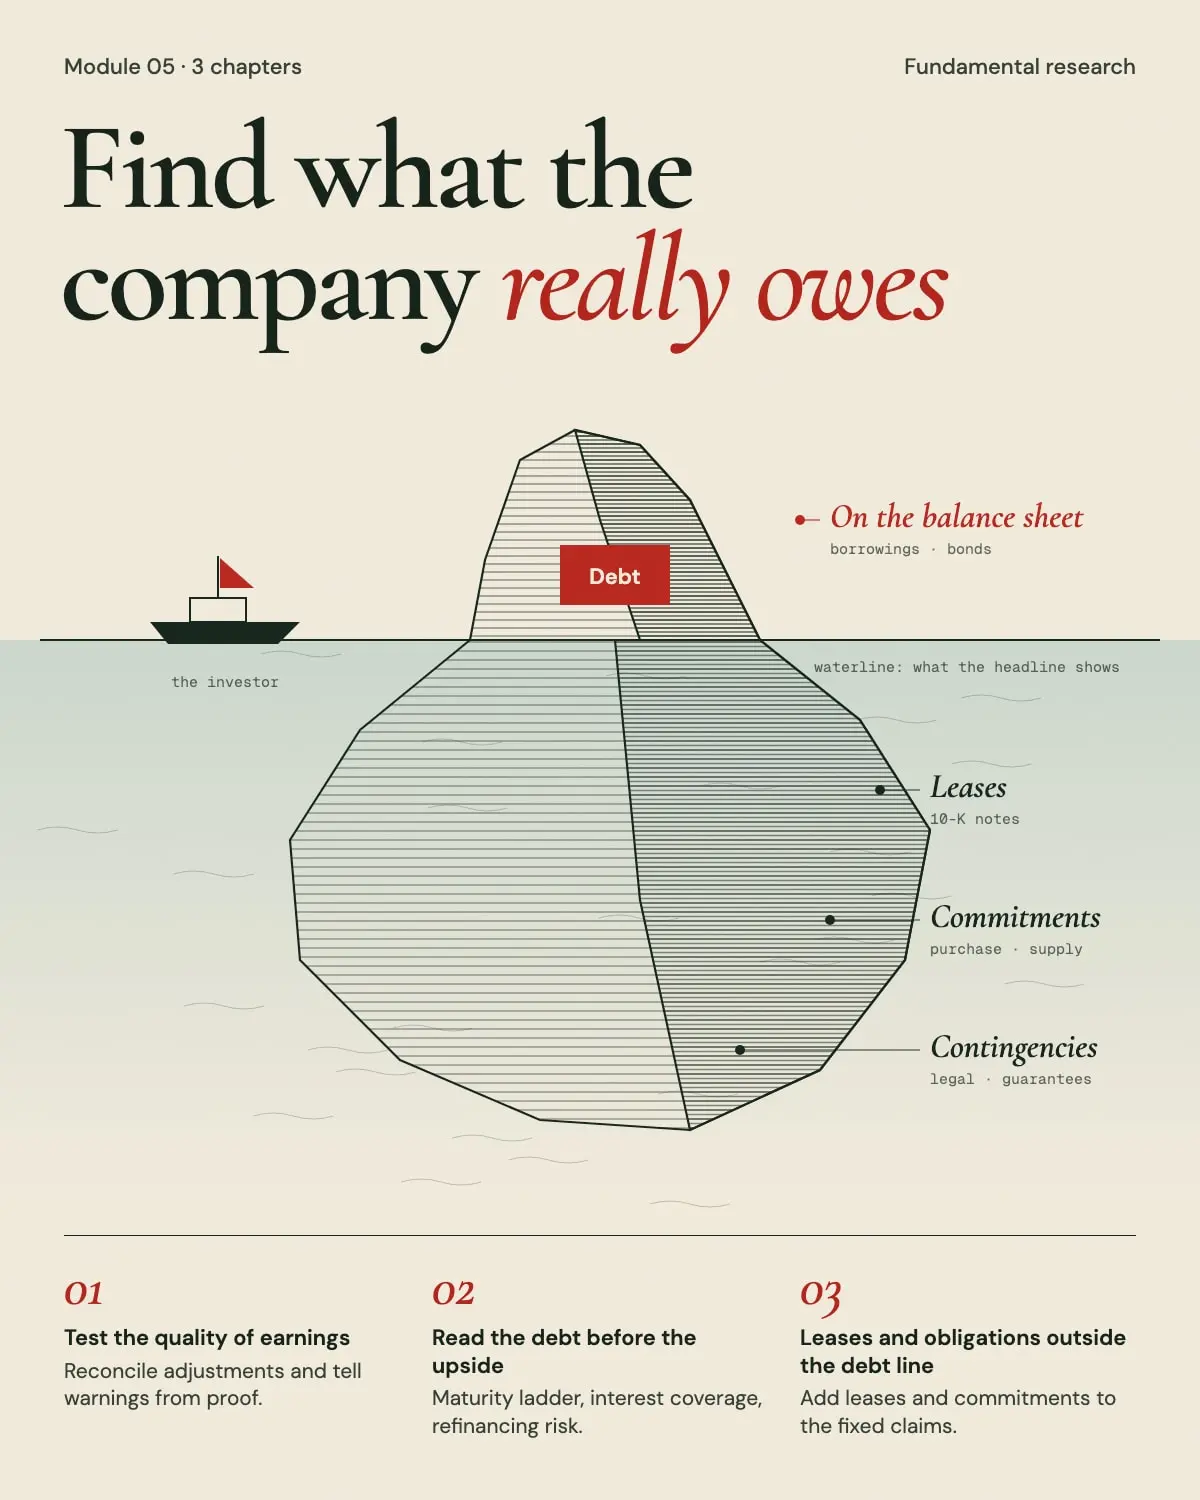
    Test the quality of earnings

    Reconcile adjustments, investigate accruals, and distinguish a warning from proof.

    12 min · Interactive model · Members

  2. 10

    Read the debt before the upside

    Build a maturity ladder and test interest coverage and refinancing risk.

    12 min · Interactive model · Members

  3. 11

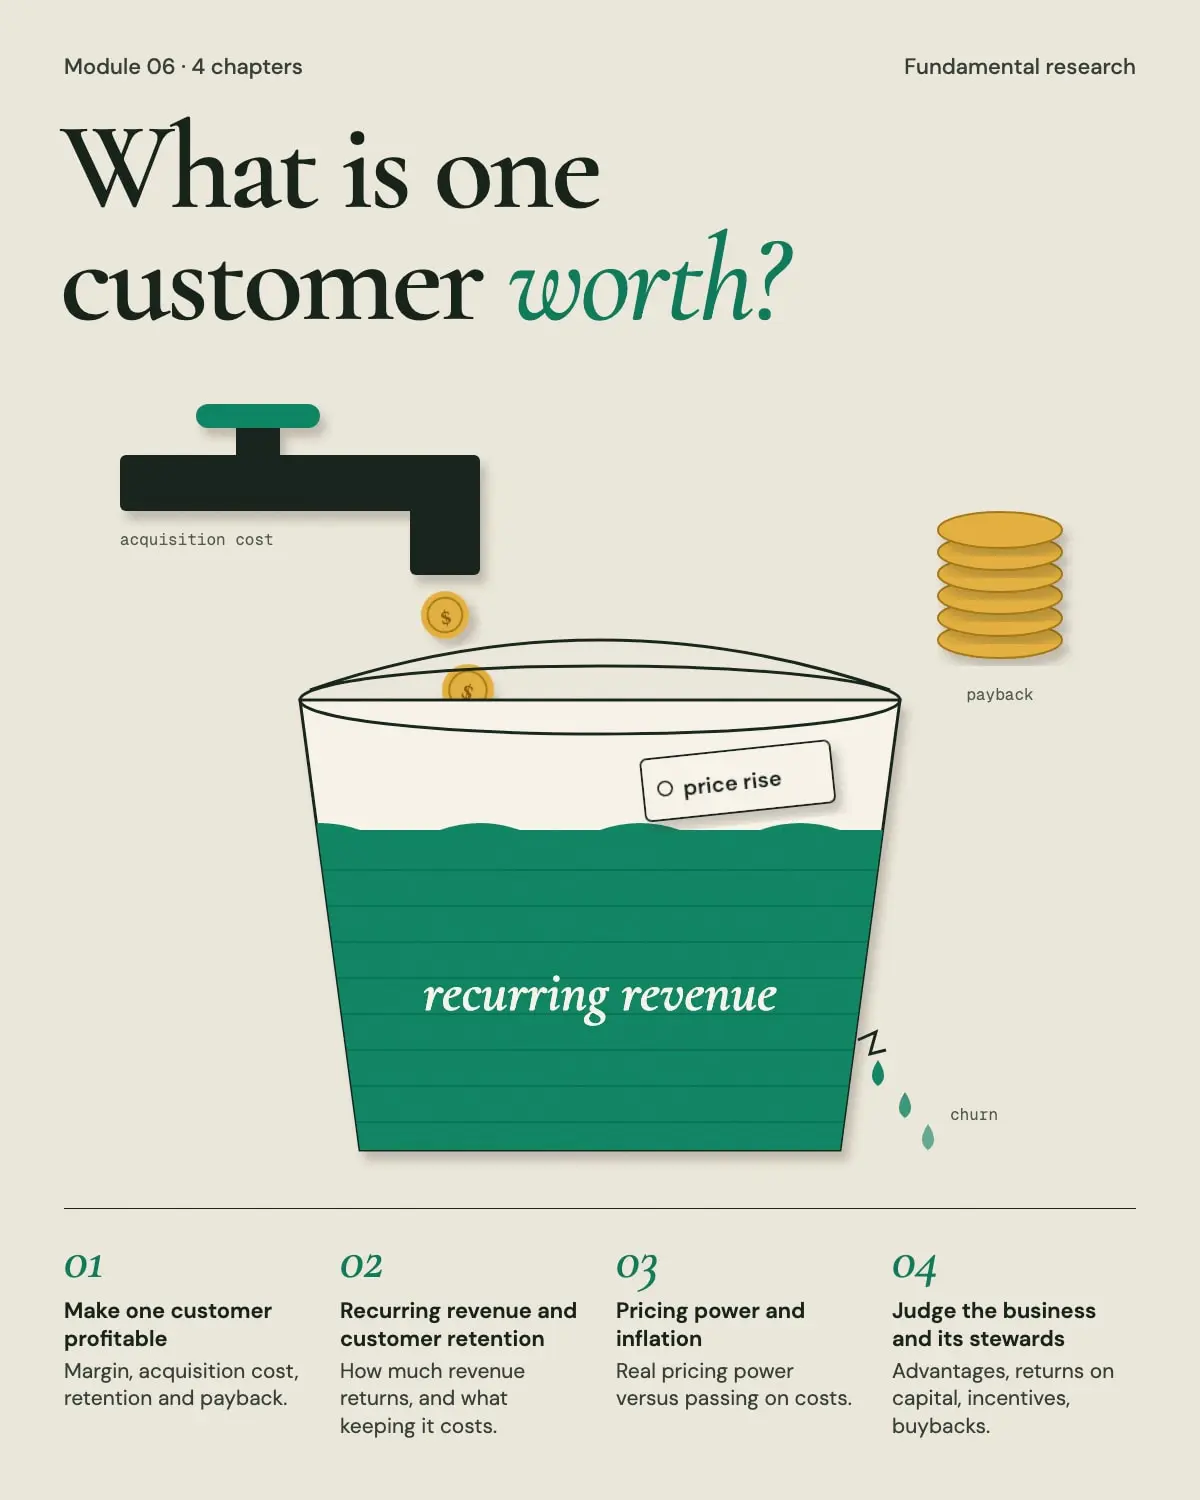
    Make one customer profitable

    Connect contribution margin, acquisition cost, retention, and payback.

    12 min · Interactive model · Members

  4. 12

    Judge the business and its stewards

    Test competitive advantages, return on capital, incentives, and buybacks.

    12 min · Interactive model · Members

MODULE 4

Quality and ownership

Examine competitive advantages and capital allocation.

  1. 13

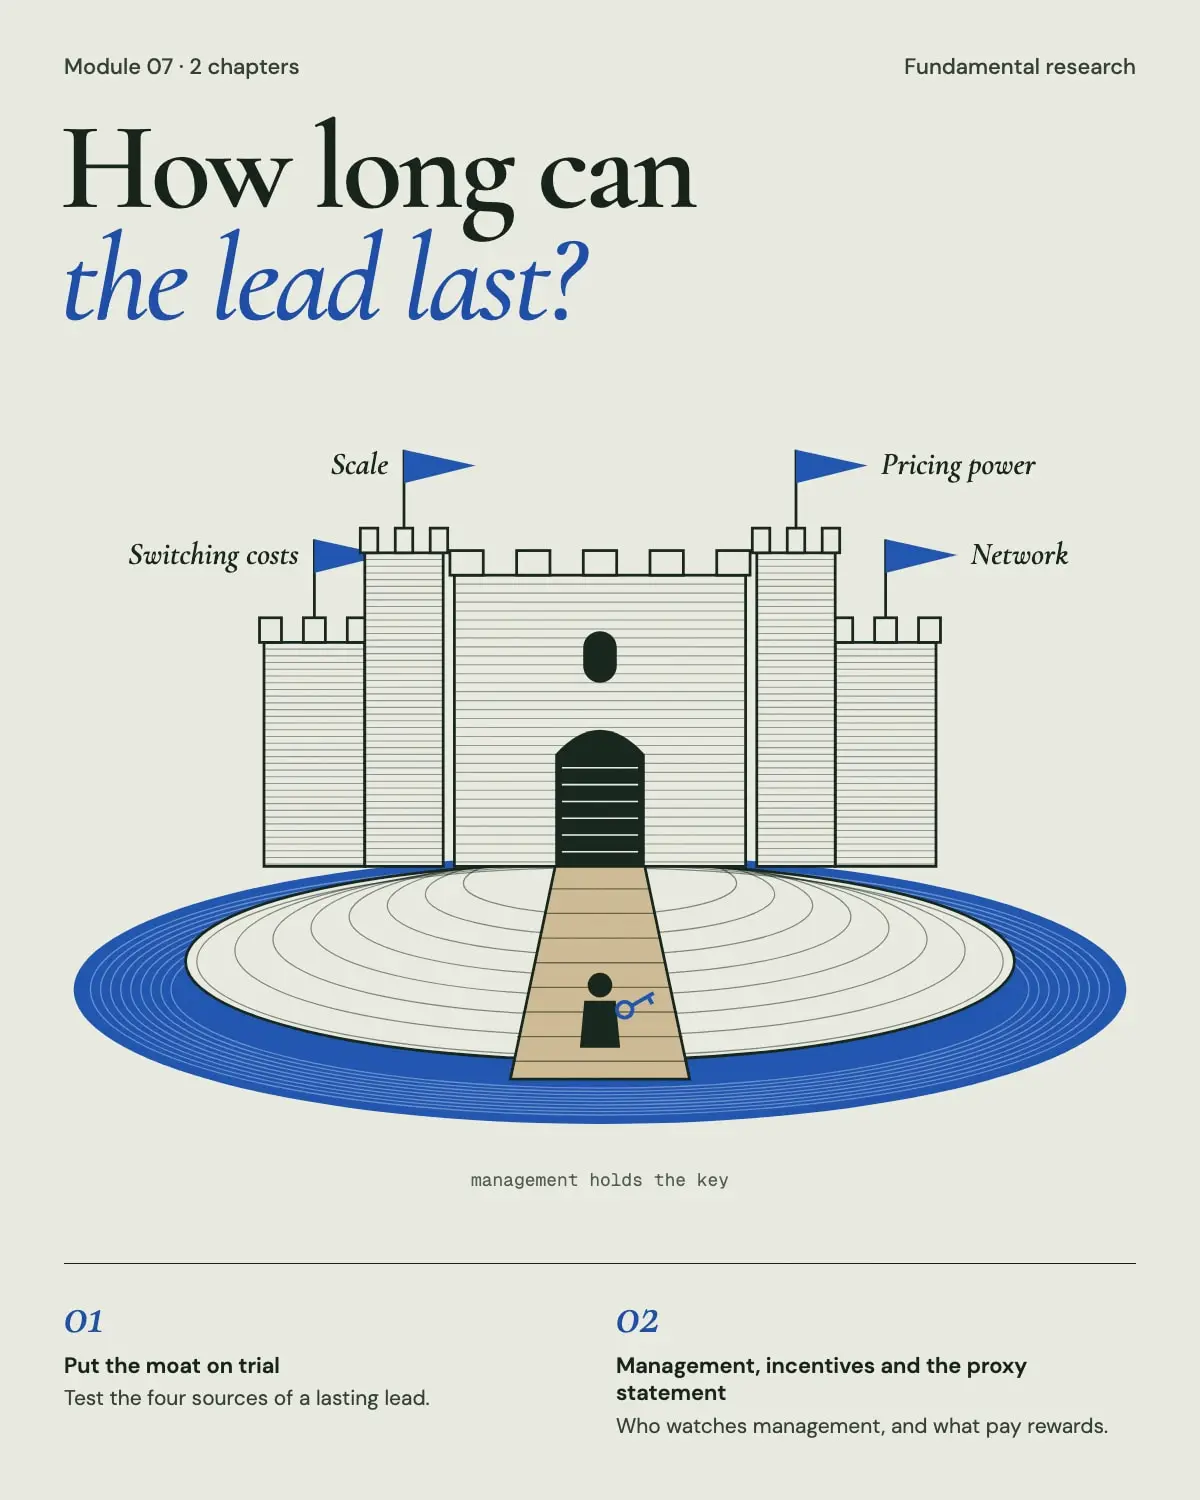
    Put the moat on trial

    Test switching costs, scale, networks, and pricing power against rival explanations.

    12 min · Interactive model · Members

  2. 14

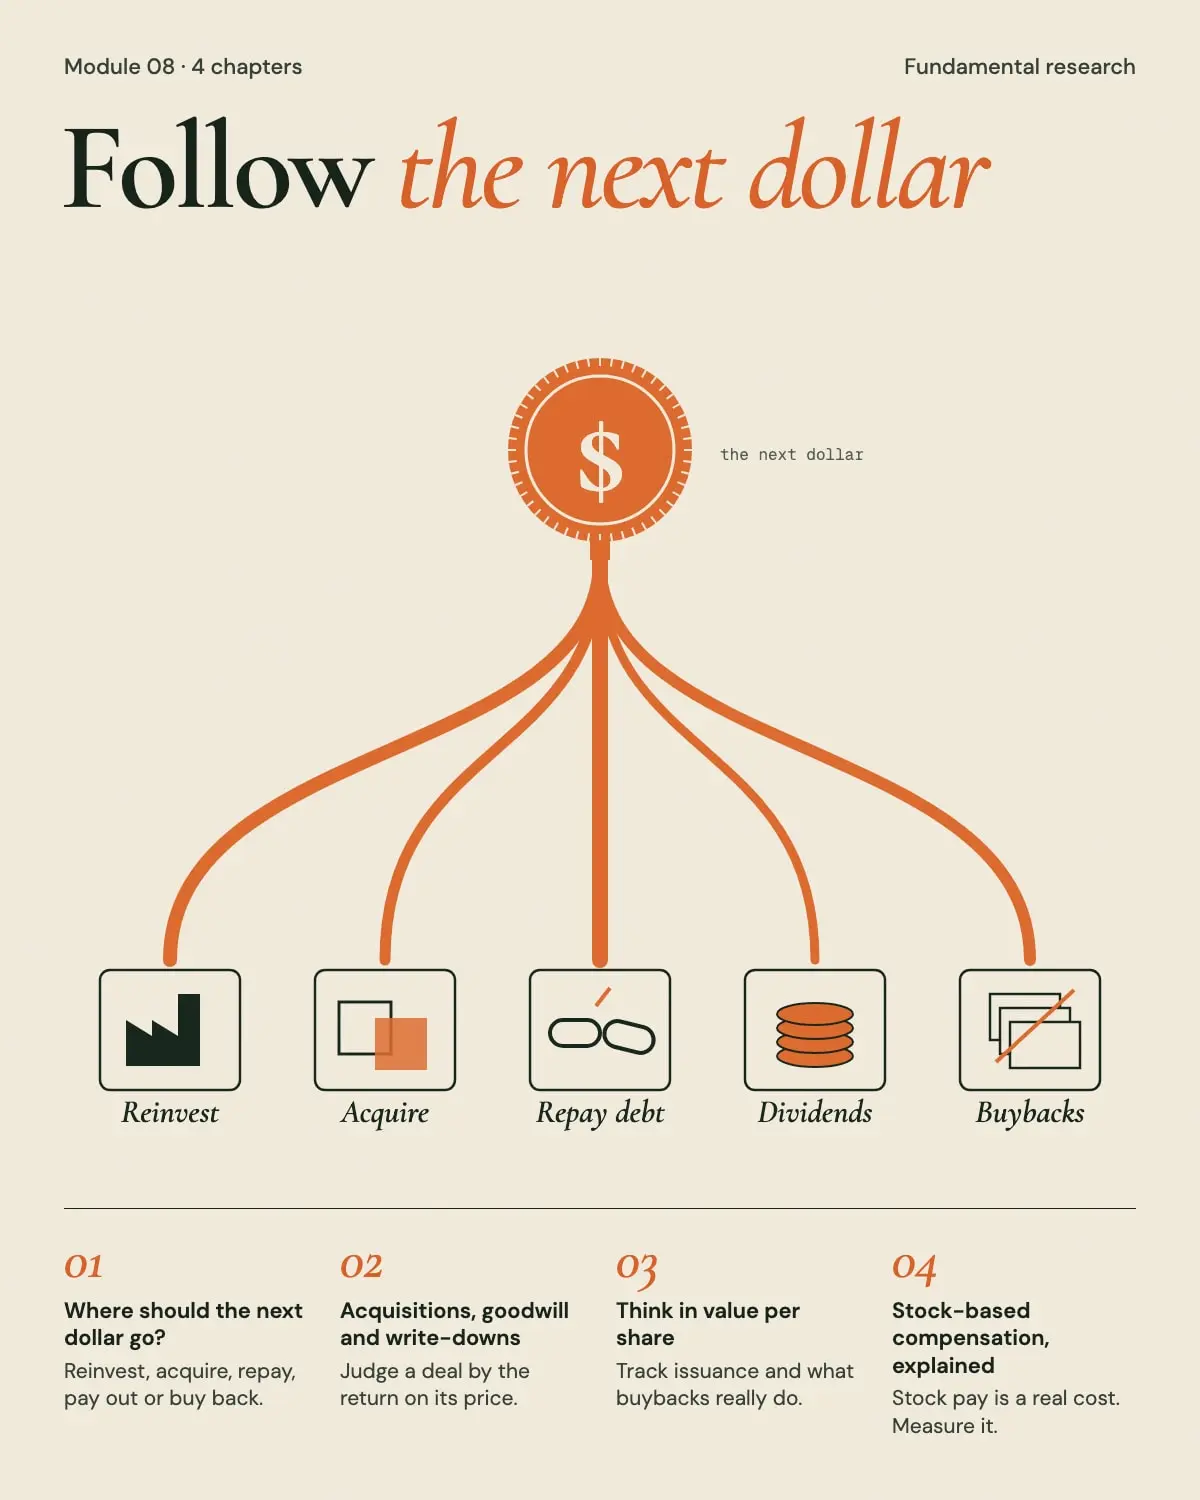
    Where should the next dollar go?

    Compare reinvestment, acquisitions, debt repayment, dividends, and buybacks.

    12 min · Interactive model · Members

  3. 15

    Think in value per share

    Track stock compensation, share issuance, and the real effect of repurchases.

    12 min · Interactive model · Members

  4. 16

    Put a price on the expectations

    Use multiples and a simple discounted cash-flow model with consistent inputs.

    12 min · Interactive model · Members

MODULE 5

Valuation

Build, reverse, and challenge a valuation.

  1. 17

    Normalize before you compare

    Choose consistent multiples and avoid peak-cycle earnings and mismatched peers.

    12 min · Interactive model · Members

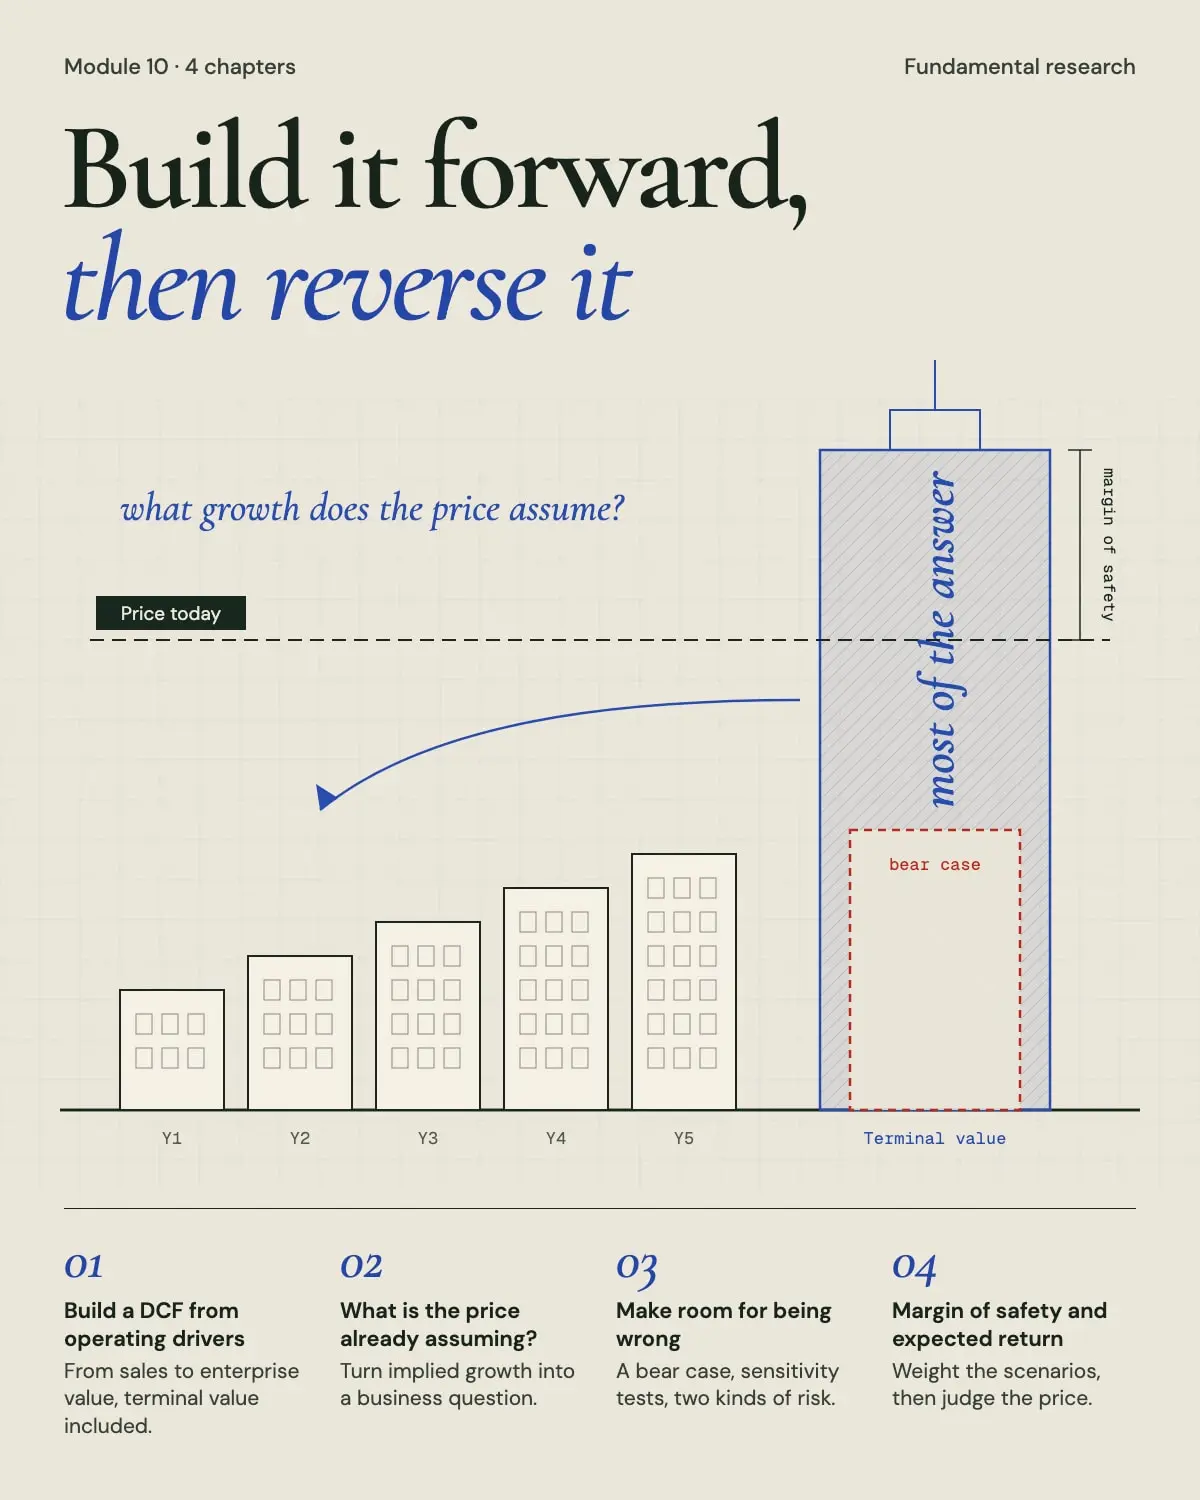
  2. 18

    Build a DCF from operating drivers

    Walk from sales to enterprise value and understand terminal-value dependence.

    12 min · Interactive model · Members

  3. 19

    What is the price already assuming?

    Reverse the valuation and turn implied growth into a business question.

    13 min · Interactive model · Members

  4. 20

    Make room for being wrong

    Build a bear case, test sensitivity, and separate business risk from portfolio risk.

    12 min · Interactive model · Members

MODULE 6

The research process

Apply the tools across cycles and keep a decision journal.

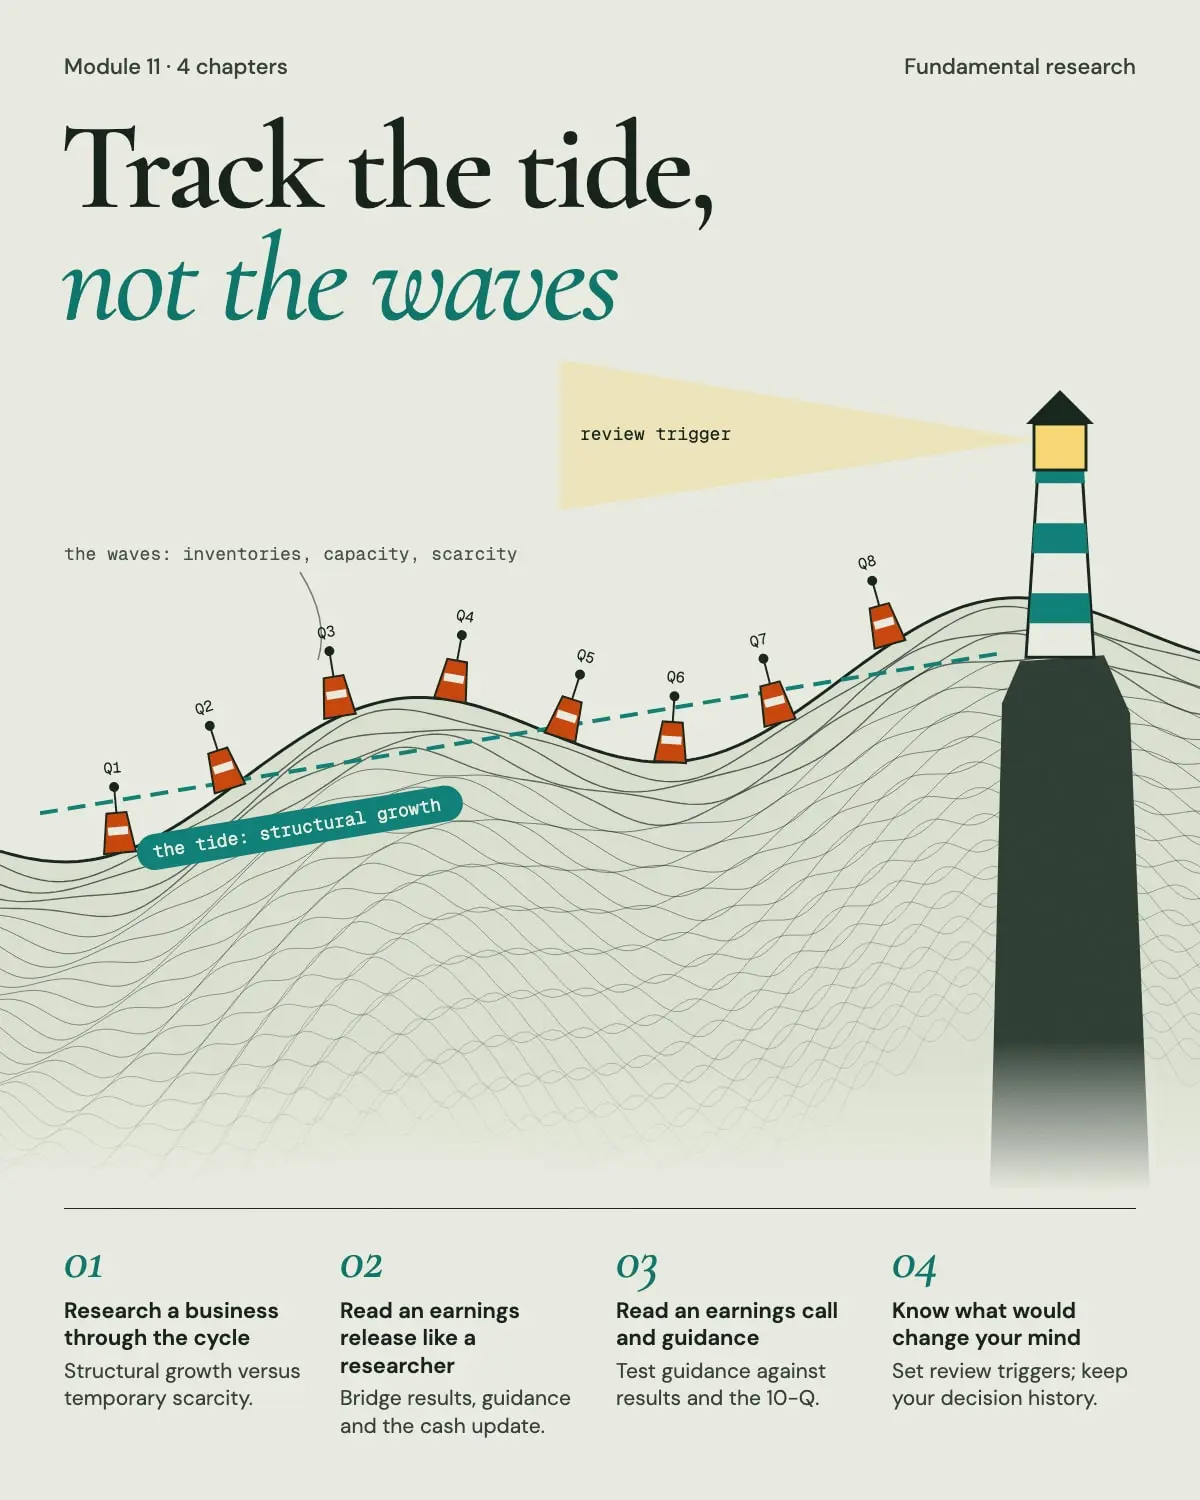
  1. 21

    Research a business through the cycle

    Separate structural growth from capacity, inventories, and temporary scarcity.

    12 min · Interactive model · Members

  2. 22

    Read an earnings release like a researcher

    Bridge reported results, guidance, expectations, and the cash-flow update.

    12 min · Interactive model · Members

  3. 23

    Know what would change your mind

    Create observable review triggers and preserve the history of your decisions.

    12 min · Interactive model · Members

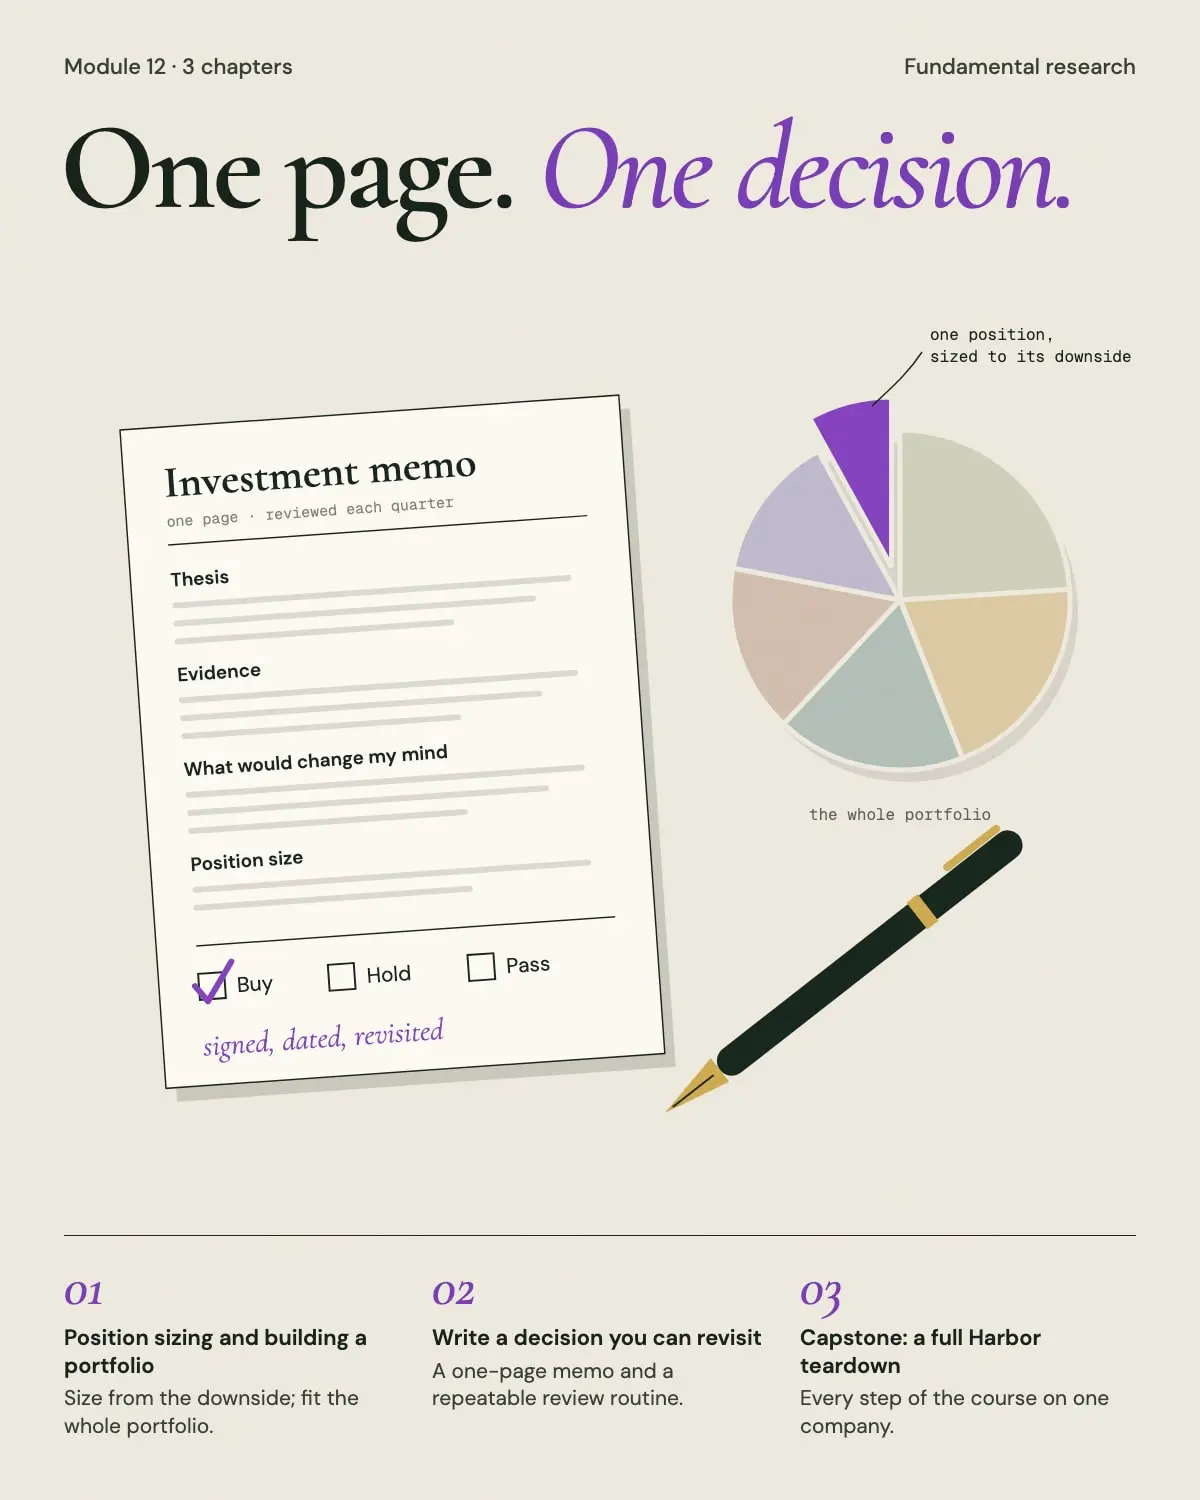
  4. 24

    Write a decision you can revisit

    Bring the evidence together in a one-page memo and a repeatable review routine.

    13 min · Interactive model · Members