AI Capital Spending Is Becoming a Macro Variable
The artificial-intelligence investment boom has escaped the technology sector.
That is not a metaphor. In the minutes of its June meeting, the Federal Reserve discussed AI infrastructure as a source of real economic growth and near-term price pressure. Officials pointed to data centers, high-tech equipment and software as drivers of business investment. Many also said strong demand for AI infrastructure could keep prices for technology products and electricity elevated.
The debate inside the Fed captures the current market better than another argument about which model leads a benchmark. AI may eventually lift productivity and reduce costs. Before that payoff arrives, companies have to build the physical system that makes the software work.
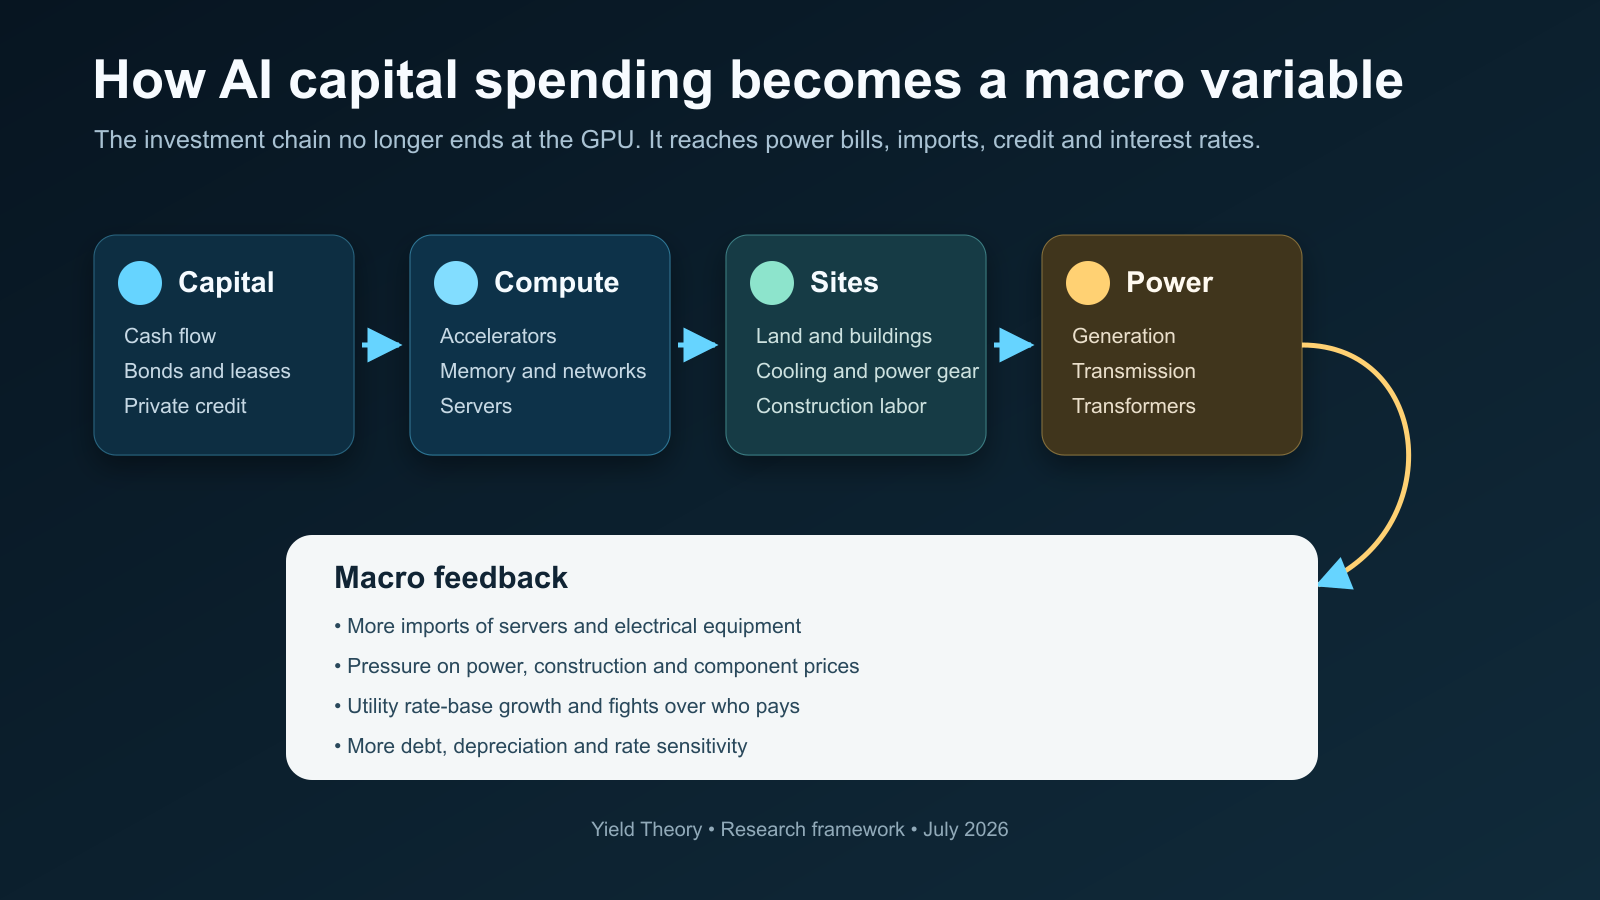
That system consumes chips, memory, networking equipment, land, cooling, transformers, turbines, construction labor and capital. It changes imports and electricity demand. It creates regulated-utility projects and private-credit exposure. It can even influence how long interest rates remain restrictive.
The AI trade is no longer one industry. It is a capital-flow map.
The spending has reached industrial scale
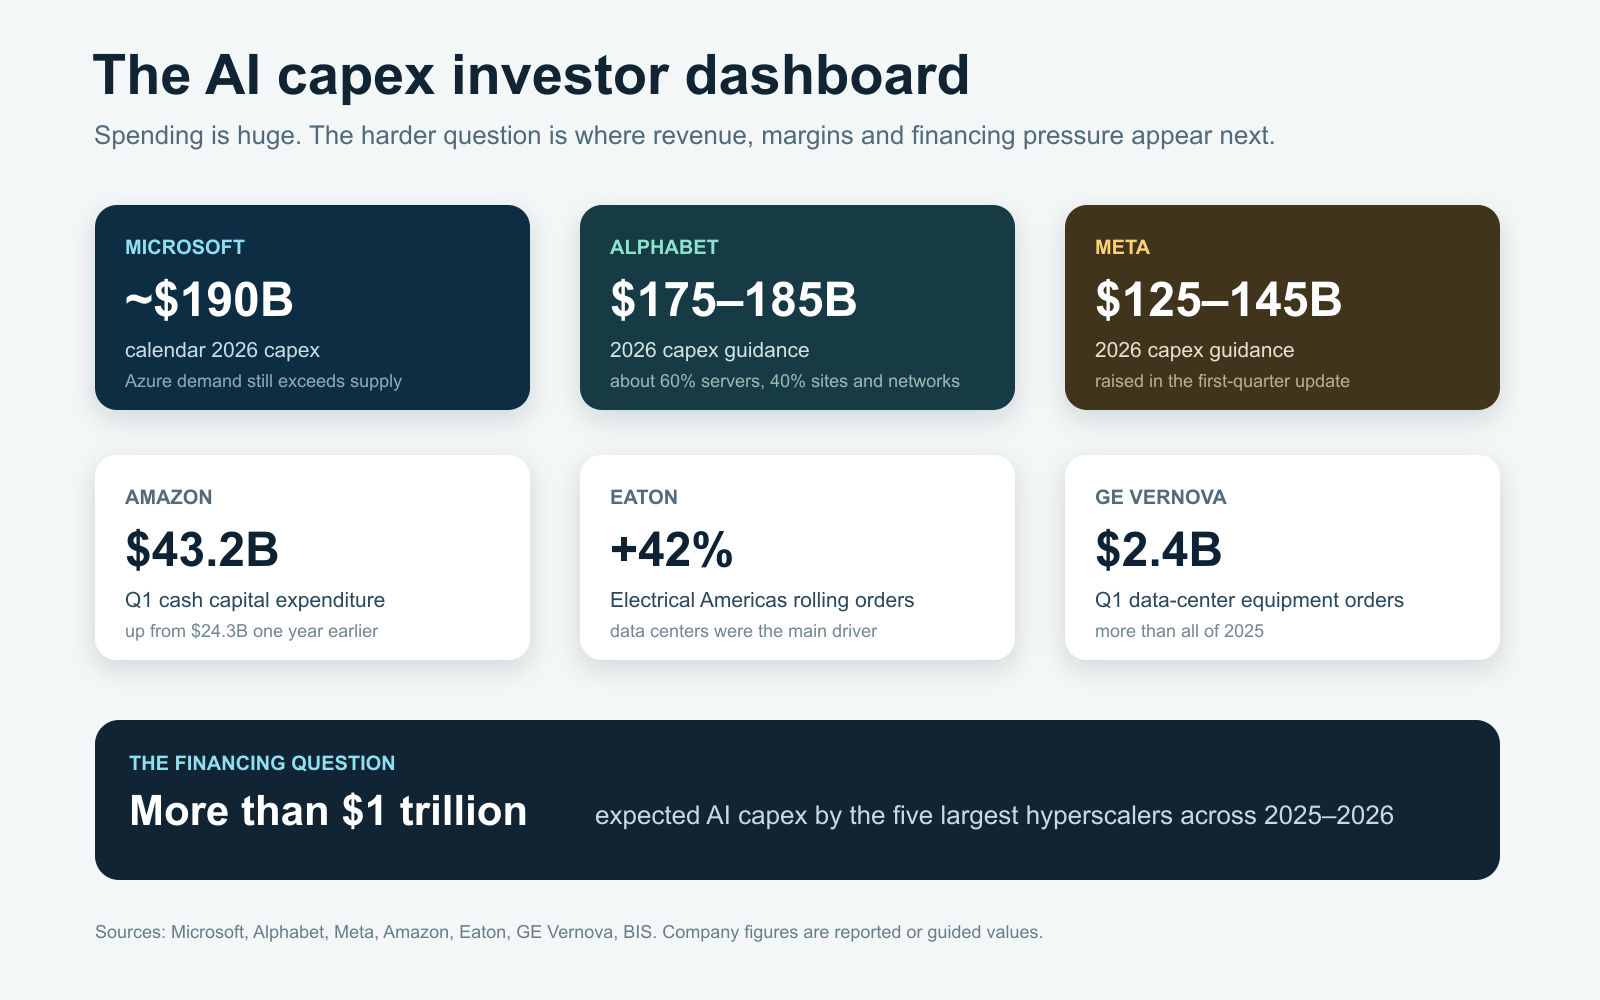
Microsoft expects roughly $190 billion of capital expenditure in calendar 2026. Alphabet has guided to $175 billion to $185 billion. Meta expects $125 billion to $145 billion. Amazon spent $43.2 billion in cash capital expenditure in the first quarter, up from $24.3 billion one year earlier.
The Bank for International Settlements estimates that the five largest hyperscalers will spend more than $1 trillion on AI-related capital across 2025 and 2026.
This spending does not move through the economy evenly. There are four broad cash registers.
1. Compute
The first register is familiar: accelerators, high-bandwidth memory, networking and servers. This is where the initial scarcity appeared and where much of the industry’s economic rent has accumulated.
But compute is not a standalone product. A server sitting in a warehouse produces no inference revenue. It has to be installed in an energized building with adequate cooling and network access. As accelerator supply improves, the binding constraint can move elsewhere.
2. The data-center site
The second register includes buildings, cooling, backup power, switchgear, busways and power-management systems. These are less glamorous than model architecture, but they determine whether expensive chips can operate reliably.
The order data already show the shift. Vertiv reported 44 percent organic sales growth in the Americas in the first quarter. At the end of 2025, its backlog had more than doubled from a year earlier. Demand is not just for racks. New high-density systems require more sophisticated liquid cooling and electrical distribution.
3. The grid
The third register sits outside the campus: substations, transformers and transmission. This is where the time mismatch becomes severe.
New compute can be ordered in quarters. Large power equipment and transmission projects can require years. The Department of Energy says distribution-transformer lead times moved from three to six months in 2019 to 12 to 30 months in 2023. Industry participants have described lead times of three to four years for some large substation transformers.
Eaton reported that rolling orders in Electrical Americas rose 42 percent organically in the first quarter, driven by data centers. Its Electrical segment backlog rose 48 percent. GE Vernova booked $2.4 billion of data-center equipment orders in its Electrification business during the quarter, more than it booked in all of 2025.
These numbers are evidence of genuine demand. They are also evidence of a bottleneck. A large backlog is valuable only if a company can source inputs, expand capacity, deliver equipment and protect margins.
4. Generation
The fourth register is power generation. Solar and storage additions are growing quickly, but data centers need dependable electricity at every hour. In regions where new transmission and clean firm power are unavailable, natural gas often becomes the bridge.
The Energy Information Administration’s July outlook expects record natural-gas consumption in the electric-power sector next year, helped by growing electricity demand and additions to the gas fleet. In a separate high-data-center-demand scenario, EIA found that gas generation could rise 7.3 percent between 2025 and 2027, compared with 1.7 percent in its base case.
The point is not that every AI query is powered by a gas turbine. The point is that marginal demand meets the generation fleet that can actually respond. The available system, not the desired system, sets near-term economics.
Electricity is where the trade becomes macro
Data centers used about 4.4 percent of US electricity in 2023. A Department of Energy summary of Lawrence Berkeley National Laboratory work puts the 2030 range between 9.5 percent and 15.3 percent.
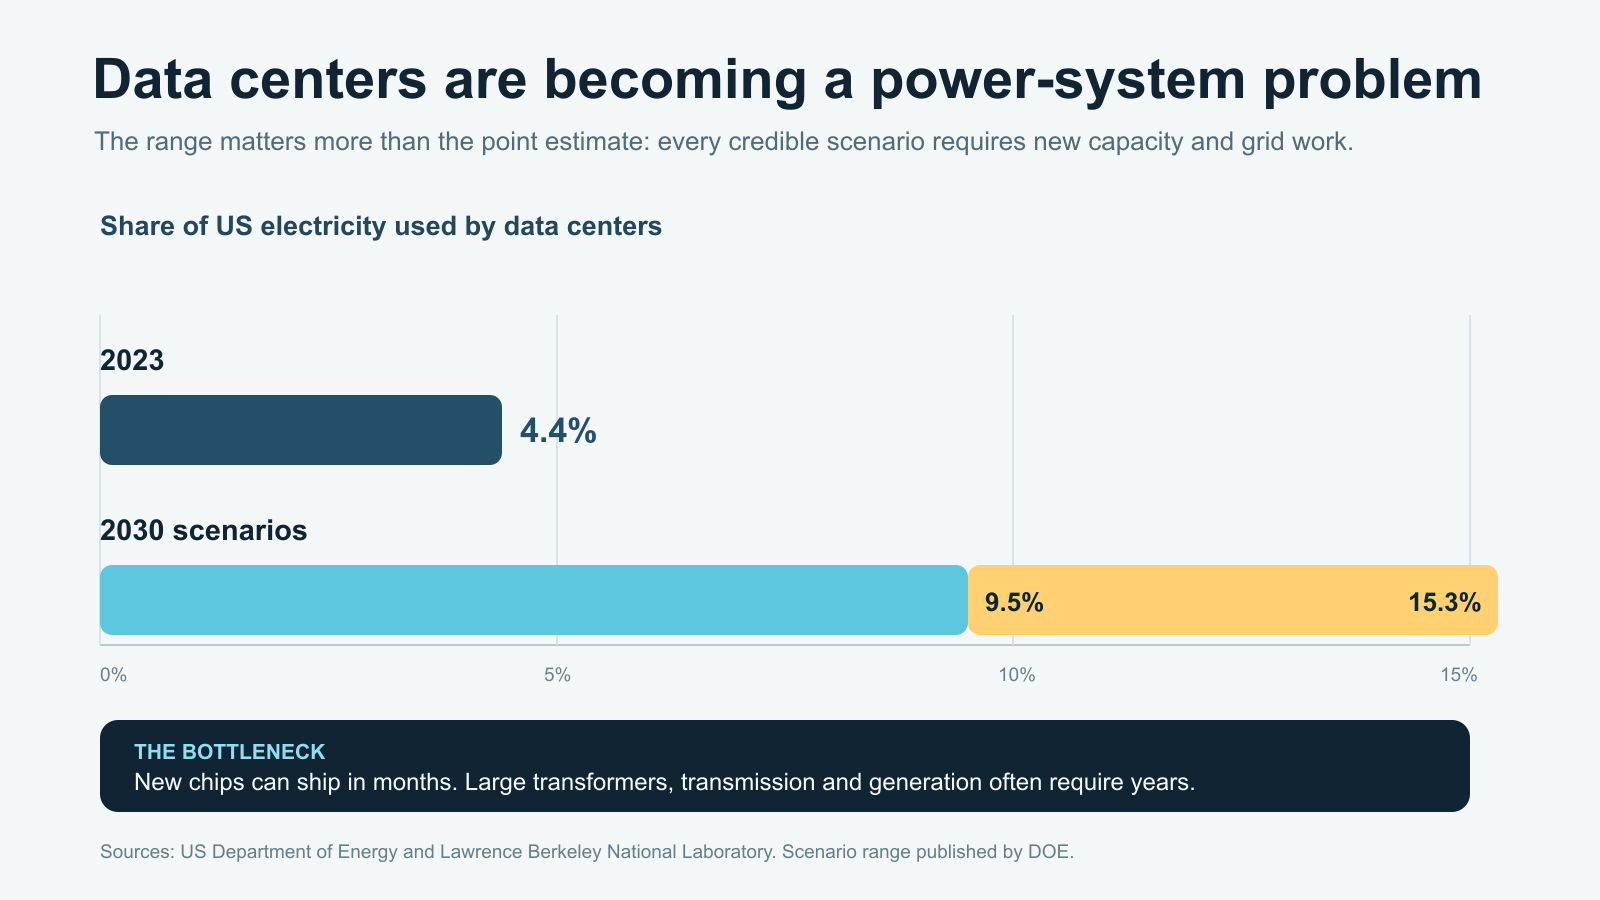
Even the low end implies a major change in a system that develops slowly. The national number also hides local concentration.
In Dominion’s Virginia zone, the summer peak reached 23,905 megawatts in 2025, 23 percent above 2019. PJM expects summer peak demand there to rise about 5.4 percent annually over the next decade. Texas is managing a similar wave of large-load requests.
Local concentration creates three investment effects.
First, utilities can expand their rate base by building infrastructure. That can support earnings if regulators approve the spending and allow an adequate return.
Second, large new loads can improve utilization of existing assets. A flat, continuous data-center load can be attractive to a generator or grid owner.
Third, the wrong cost structure can produce political backlash. A data center may request expensive network upgrades and later be canceled. If ordinary customers are left paying for stranded infrastructure, regulators will intervene.
That third issue is no longer theoretical. In June, the Federal Energy Regulatory Commission ordered six regional grid operators to justify or reform their rules for large-load connections. FERC asked how projects should be studied, how cost shifting should be prevented, how co-located generation should work and whether flexible service could reduce the need for upgrades.
Investors should therefore stop treating load growth as automatically bullish for every utility. The useful questions are:
- Is the project fully funded or only announced?
- Has the customer made a meaningful financial commitment?
- Who pays if the project is canceled?
- Does the utility earn a regulated return on the required assets?
- Can the load be interrupted during system stress?
- Is new generation arriving with the demand?
The spending also reaches trade and inflation
A Federal Reserve analysis of the global trade effects estimated that US data-center spending would exceed $500 billion in 2025. That demand increased exports from economies that supply servers and critical components.
This is a reminder that domestic capital expenditure is not fully domestic. The building may be in Virginia or Texas, while advanced chips, memory packages, network components and server assemblies cross borders. A disruption in one qualified supplier can delay a facility whose construction budget runs into billions.
The inflation channel is just as important. AI investment can raise demand for electrical equipment, construction labor, turbines and power before it creates measurable productivity gains. Microsoft said that higher component pricing added about $25 billion to its calendar 2026 capital-expenditure estimate. Meta also cited component and data-center costs when it raised guidance.
Fed officials are trying to distinguish two clocks. The first is the buildout clock, which can be inflationary because physical capacity is scarce. The second is the productivity clock, which may become disinflationary if AI allows firms to produce more with fewer inputs. Markets often price the second clock and underestimate the first.
The hidden financing layer
Hyperscalers generate enormous cash flow, but spending at this scale is broadening the financing mix. Bond issuance, leases, special-purpose vehicles and private credit are increasingly part of the structure.
The BIS analysis of AI financing says hyperscaler gross bond issuance exceeded $100 billion in 2025. It also describes off-balance-sheet arrangements in which a separate entity funds a facility while the technology company signs long-term lease or capacity commitments.
There is nothing inherently wrong with project finance. The risk is opacity. Capital expenditure can appear lower at the hyperscaler while a binding obligation appears elsewhere as rent, an offtake agreement or a project-company debt payment. If expected utilization falls, the economic burden remains.
Amazon offers a visible example of the cash-flow pressure. Its trailing 12-month purchases of property and equipment, net of incentives, reached $147.3 billion by the end of the first quarter. Free cash flow over the same period fell to about $1.2 billion from $25.9 billion a year earlier. The business is not in distress, but the numbers show how quickly an investment cycle can absorb operating cash.
This is why revenue growth alone is insufficient. Investors need to track depreciation, lease commitments, interest expense and the replacement cycle of short-lived equipment.
The counterweight: adoption still trails construction
The strongest bearish argument is not that AI has no value. It is that infrastructure commitments may be outrunning broad commercial adoption.
The Census Bureau found that current AI use among US businesses fluctuated around 17 percent to 20 percent between December and May. Usage is much higher among large firms and in information and finance, but the economy-wide base remains limited.
A Federal Reserve adoption review reached a similar conclusion: roughly 18 percent of firms had adopted AI by the end of 2025, although employee use of generative tools was more widespread.
That gap is the core uncertainty. Infrastructure is being built for a demand curve that has not fully arrived. The healthy version of the story is that better applications, lower inference costs and broader adoption fill the capacity. The unhealthy version is that duplicate grid requests, overly optimistic reservations and weak application economics produce cancellations.
Efficiency cuts both ways. Better chips and models can reduce the cost of each task, stimulating more usage. They can also reduce the number of servers or megawatt-hours required to deliver a fixed amount of value. Nobody knows the final balance yet.
A practical investor dashboard
The following indicators separate a durable industrial expansion from a temporary scarcity cycle.
- Energized megawatts, not announced megawatts. A press release is not an operating asset.
- Backlog conversion. Watch revenue and cash, not just orders.
- Cloud backlog conversion. Hyperscaler commitments have to become recognized sales.
- Depreciation and free cash flow. These reveal the cost of keeping the compute fleet current.
- Transformer and turbine lead times. Shortening lead times can signal easing scarcity before company commentary does.
- Large-load deposits and cancellation rules. Stronger commitments improve the quality of utility forecasts.
- Commercial adoption. Infrastructure needs recurring workloads, not demonstrations.
- Electricity prices and gas burn. These show whether the buildout is becoming a visible macro input.
The next stage of AI investing will reward a wider field of companies, but it will also punish loose thinking. A supplier can own a real bottleneck and still be a poor investment if the market has capitalized years of perfect execution. A hyperscaler can possess extraordinary demand and still destroy value if depreciation and financing costs rise faster than revenue. A utility can enjoy load growth and still lose a regulatory fight over who pays.
The useful question is no longer “Who has AI exposure?” Almost everyone will claim it.
The useful question is: Where does each new dollar of AI capital go, what scarce asset does it encounter, and who keeps the economics after the constraint clears?
That is the map investors need now.
The paid Yield Theory issue extends this framework into a company scorecard, three 2026–2028 scenarios, a catalyst calendar and explicit signals that would change the thesis. Join Yield Theory for the full research letter.
Sources
- Federal Reserve: Minutes of the June 2026 FOMC meeting
- EIA: Annual Energy Outlook 2026
- EIA: July 2026 Short-Term Energy Outlook
- Department of Energy: Draft 2026 National Transmission Needs Study
- FERC: Large-load integration orders
- BIS: Financing the AI investment boom
- Microsoft fiscal 2026 third-quarter earnings
- Meta first-quarter 2026 results
- Amazon first-quarter 2026 Form 10-Q
Research cutoff: July 14, 2026, 5:49 a.m. Eastern Time. June CPI had not yet been released at that cutoff. This article is general market commentary, not personalized investment advice.
This one was on the house.
The monthly research and stock recommendations are for members. $24.99/month, cancel anytime.